Resolution & Scale
These properties can influence our choice of model.
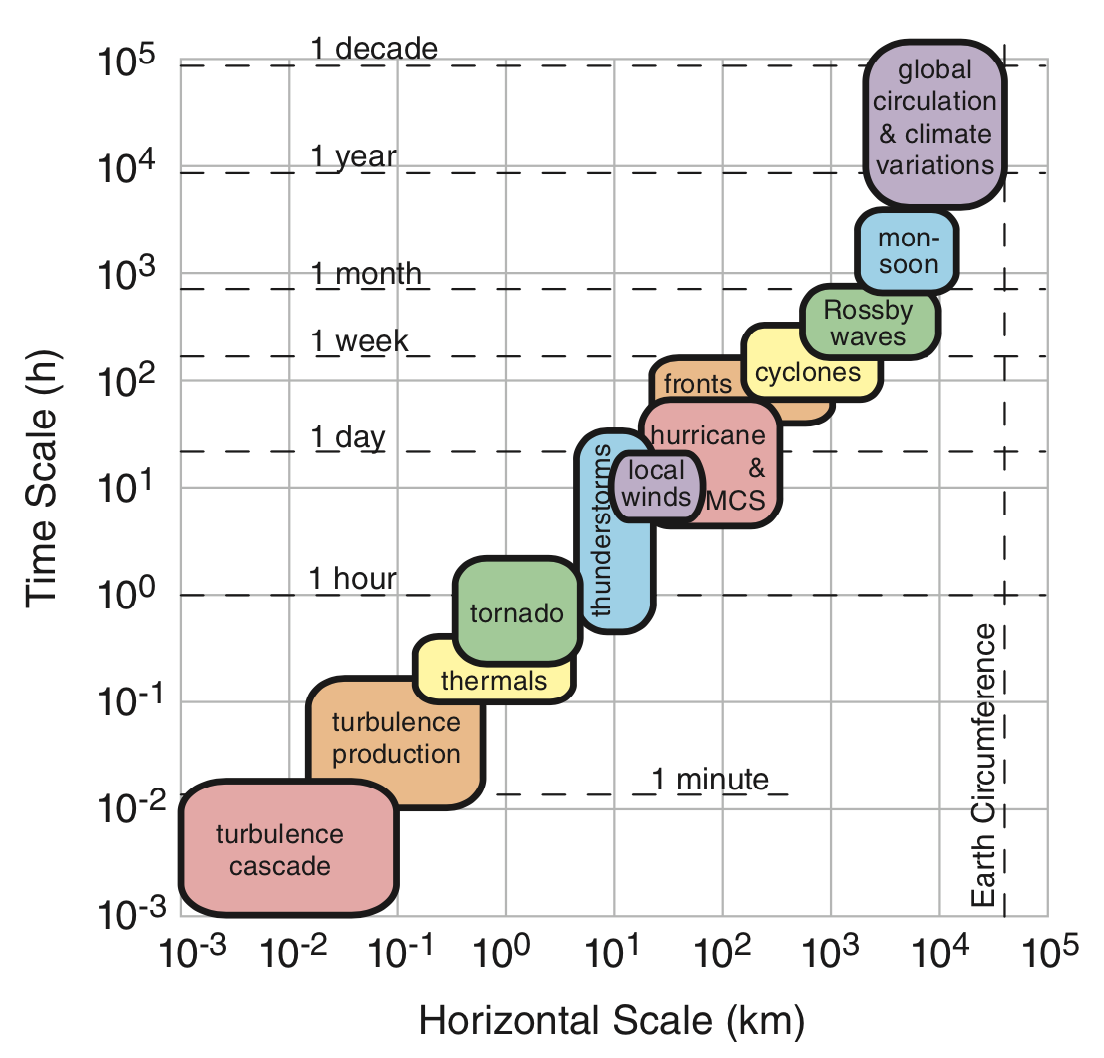
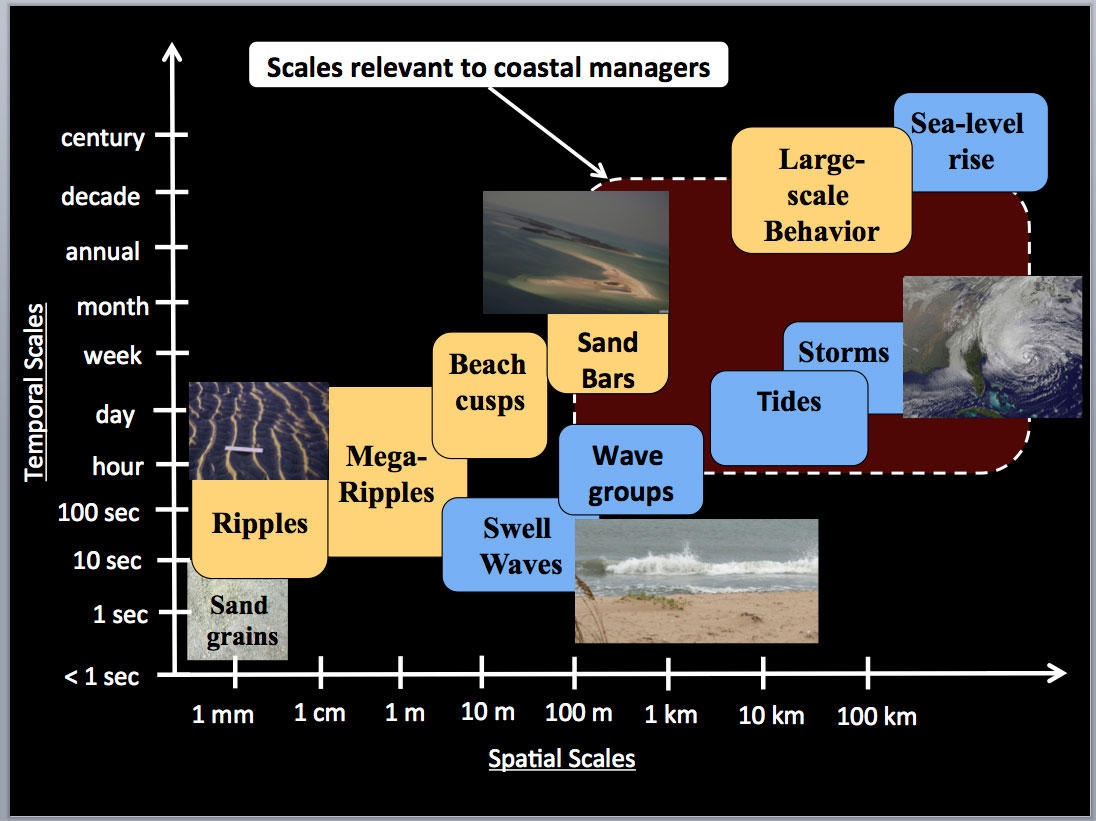
- How does the scale of our analysis dictate our desired resolution?
- How can resolution of the data limit the scale of our analysis?
Resolution & Scale
These properties can influence our choice of model.
- How does the scale of our analysis dictate our desired resolution?
- How can resolution of the data limit the scale of our analysis?
Resolution & Scale
These properties can influence our choice of model.
- How does the scale of our analysis dictate our desired resolution?
- How can resolution of the data limit the scale of our analysis?
Resolution & Scale
These properties can influence our choice of model.
- How does the scale of our analysis dictate our desired resolution?
- How can resolution of the data limit the scale of our analysis?

Working Together
Frequently we work with both raster and vector data.
- In Module 1, you worked with:
- Cholera deaths (points)
- Vector Data Model
- Kernel density (probability of deaths)
- Raster Data Model
- Cholera deaths (points)

Working Together
In the Module 4 you are working with both data models.
- NDVI Data (Raster)
- Census Data (Vector)

Working Together
Exploring two approaches:
- Zonal Statistics:
- Faster, but more limited applicability.
- Conversion:
- Requires more work, but is more flexible.