Frequency Distribution
Frequency of occurrence, typically in a qualitative dataset.
- Bar charts help visualize frequency distributions
- Counts per category

Probability Distribution
Probability of occurrence in a quantitative dataset.
- Normal Distribution:
- Idealized, based on distance from the mean in standard deviations.
- Assumed in many statistical tests.

| ±1 \(\sigma\) | 68% obs. |
| ±2 \(\sigma\) | 95% obs. |
| ±3 \(\sigma\) | 99.7% obs. |
Histograms
Sorts and groups data into bins of consistent width.
- Approximate a probability distribution
- Grouping data into classes
- Outlier detection
- Not the same as bar charts
Deviating from the Norm
Data rarely fits a normal distribution perfectly:
Skew: deviates from a normal distribution
Tails with outliers
Kurtosis: deviates from a normal distribution
Dispersed or clustered
Near Normal
Deviating from the Norm
Data rarely fits a normal distribution perfectly:
Skew: deviates from a normal distribution
Tails with outliers
Kurtosis: deviates from a normal distribution
Dispersed or clustered
Skewed Normal
Deviating from the Norm
Data rarely fits a normal distribution perfectly:
Skew: deviates from a normal distribution
Tails with outliers
Kurtosis: deviates from a normal distribution
Dispersed or clustered
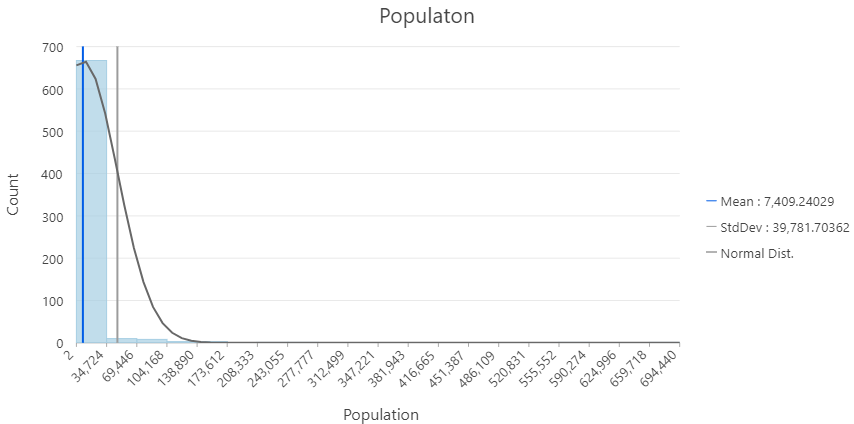
Highly Skewed
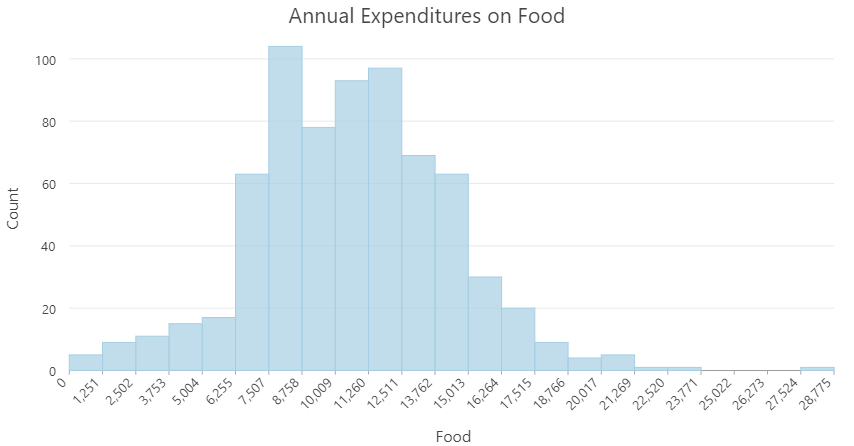
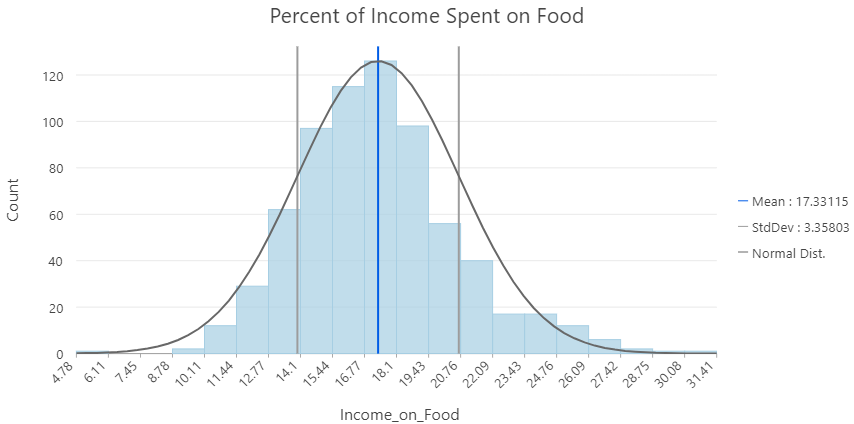
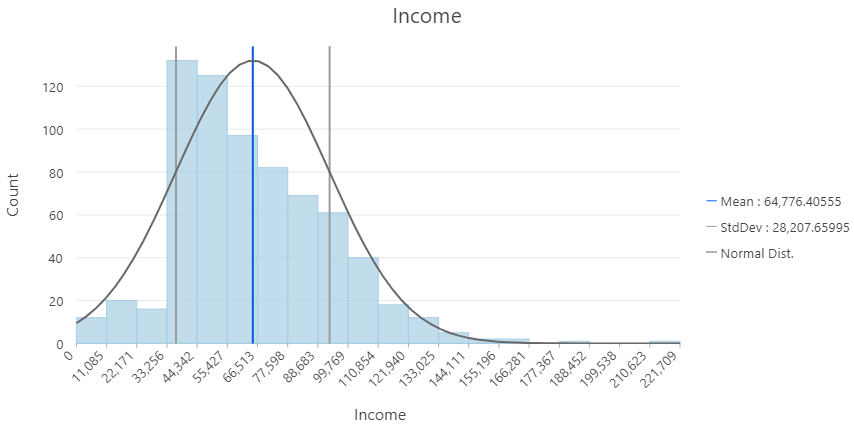
Normalizing Data
Scaling a variable by another can reveal hidden patterns in our data.
- Income vs. money spent on food
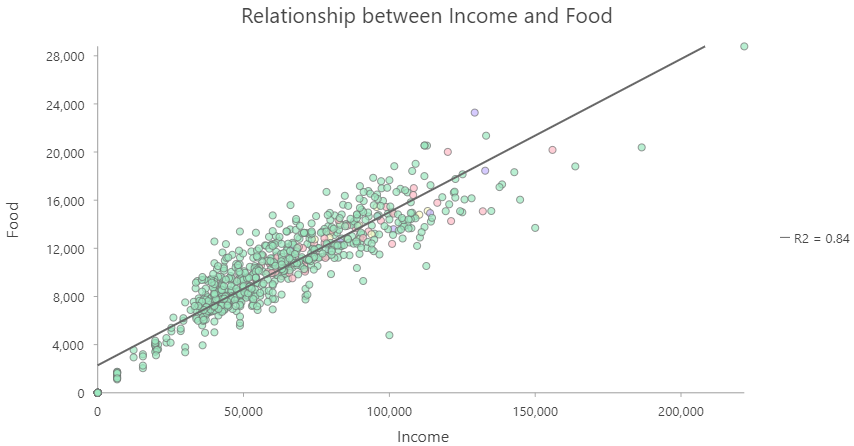
Highly Correlated
Normalizing Data
Scaling a variable by another can reveal hidden patterns in our data.
- Income vs. money spent on food
- Population vs. shape area
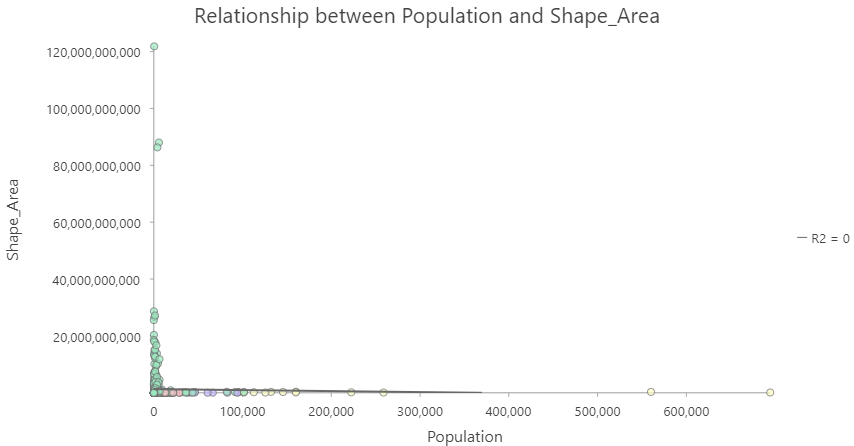
No Correlation
Multiple Confounders
Not always straightforward to account for multiple variables.
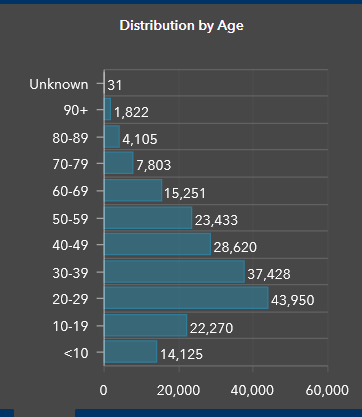
- e.g., COVID by age groups

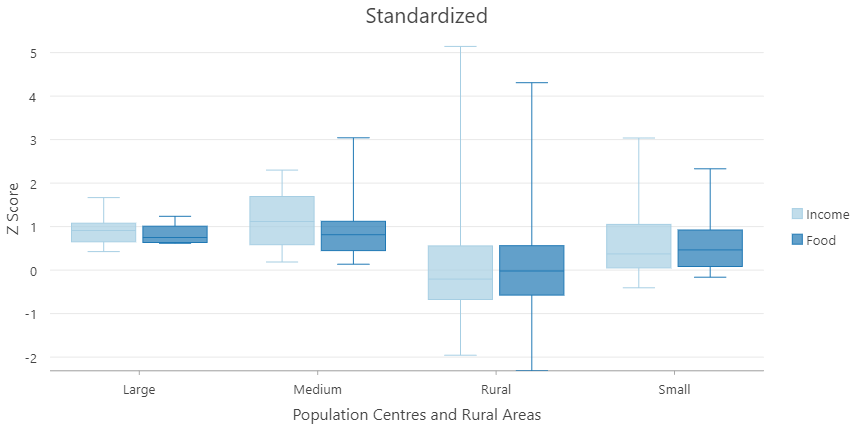
Standardizing
Allow us to compare between two or more variables in different units / scales.
- \(z = \frac{x-\overline{U}}{\sigma}\)
- Similar to normalizing:
- Remove the mean and standard deviation from multiple variables
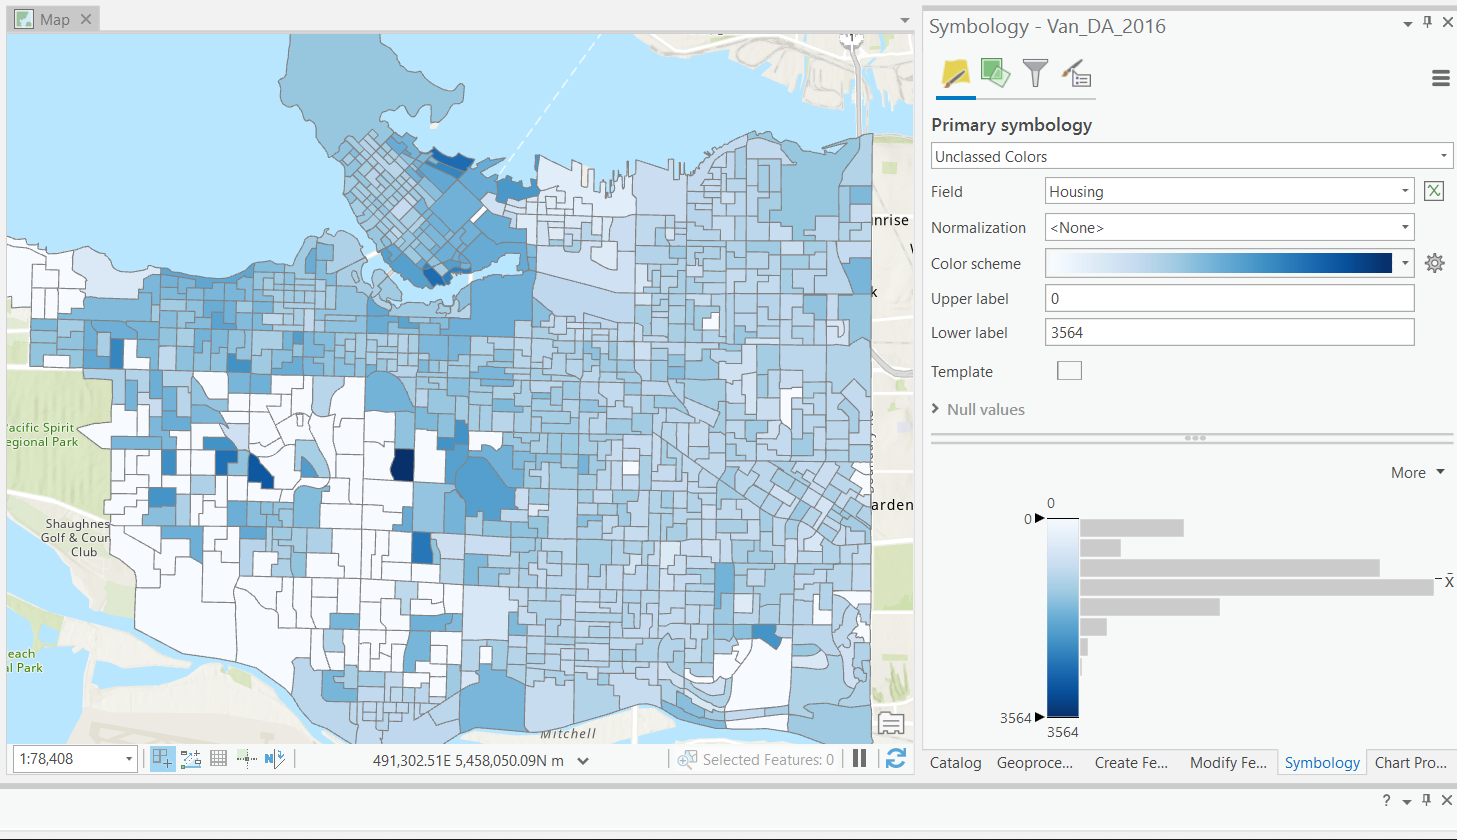
Common Examples in Arc Pro
Vancouver dissemination areas by population total:
Not classified
- Color scheme is stretched between min/max
- Difficult to see patterns
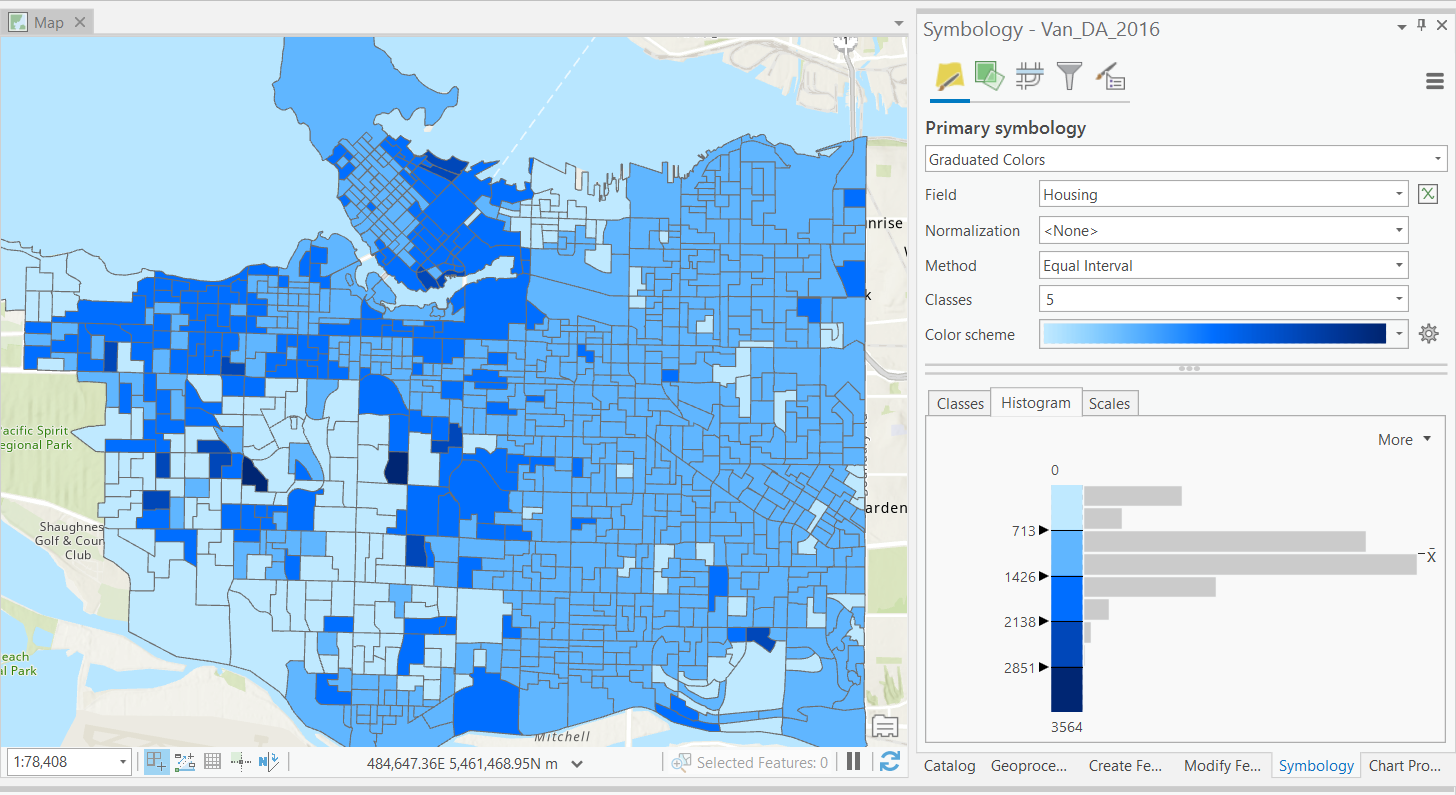
Equal Interval
One of the simplest classification schemes.
- Data is split to classes of equal width based on the range.
- Unsupervised: user defines number of bins.
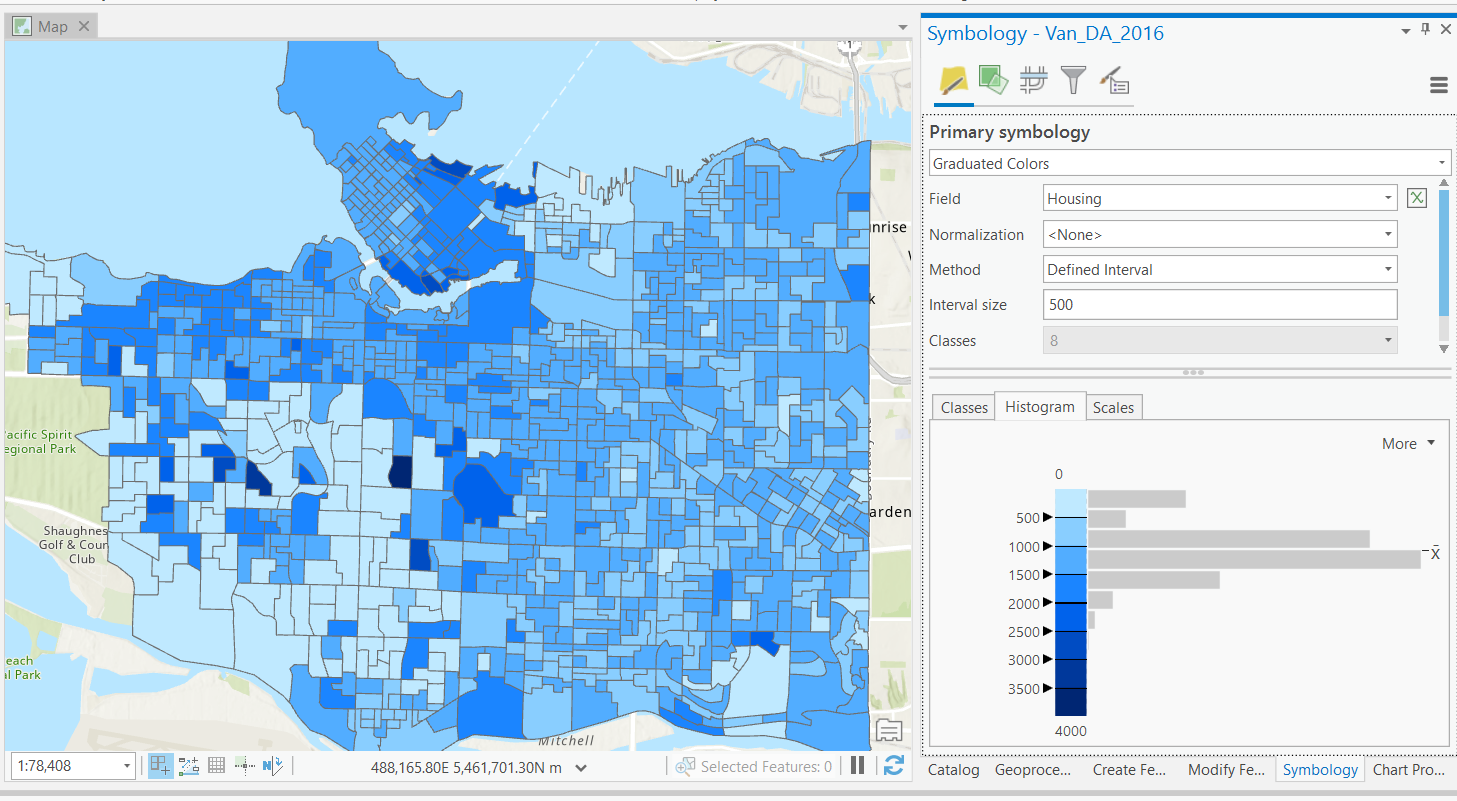
Defined Interval
Another of the simplest classification schemes.
- Data is split to classes of equal width based on the range.
- Unsupervised: user defines bin width.
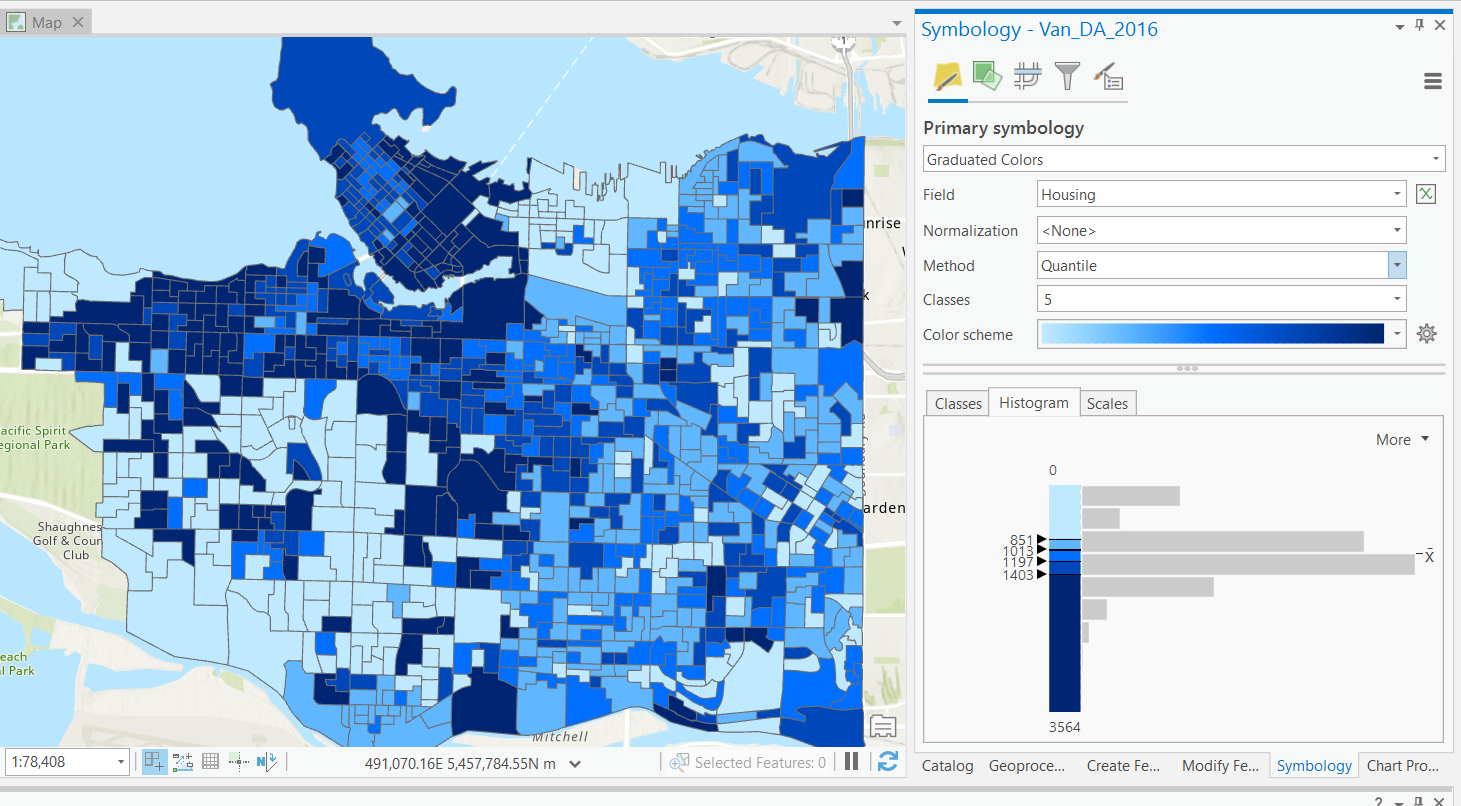
Quantiles
Slightly more complex classification scheme.
- Data is split into classes by percentiles.
- e.g. 0-20%, 20-40%, … 80-100%.
- Unsupervised: user defines number of bins.
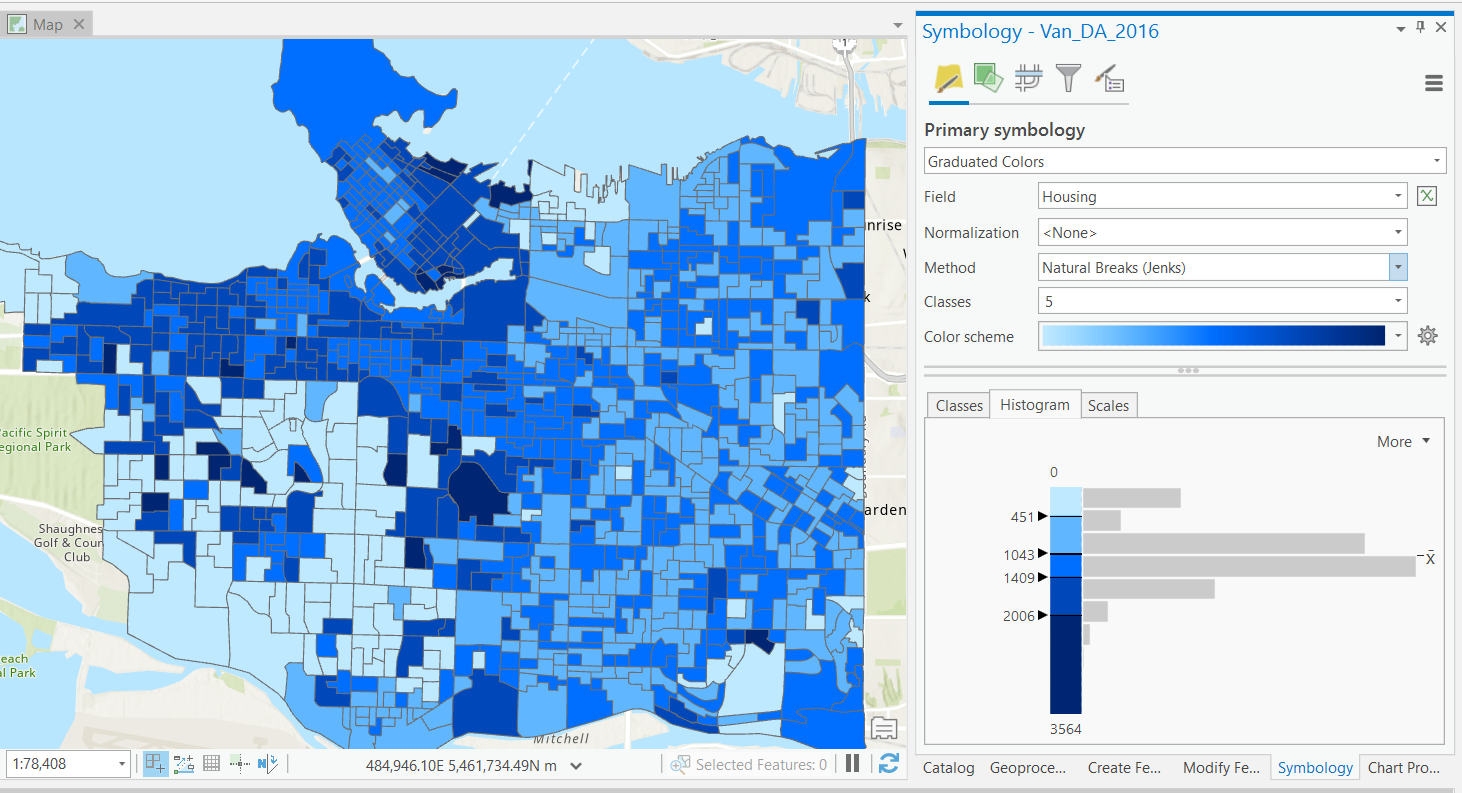
Natural Breaks
More complex, data is split using the Jenks algorithm.
- Optimizes splits, by maximizing within group similarity and between group dissimilarity.
- “Natural” classes.
- Unsupervised: user defines number of bins.
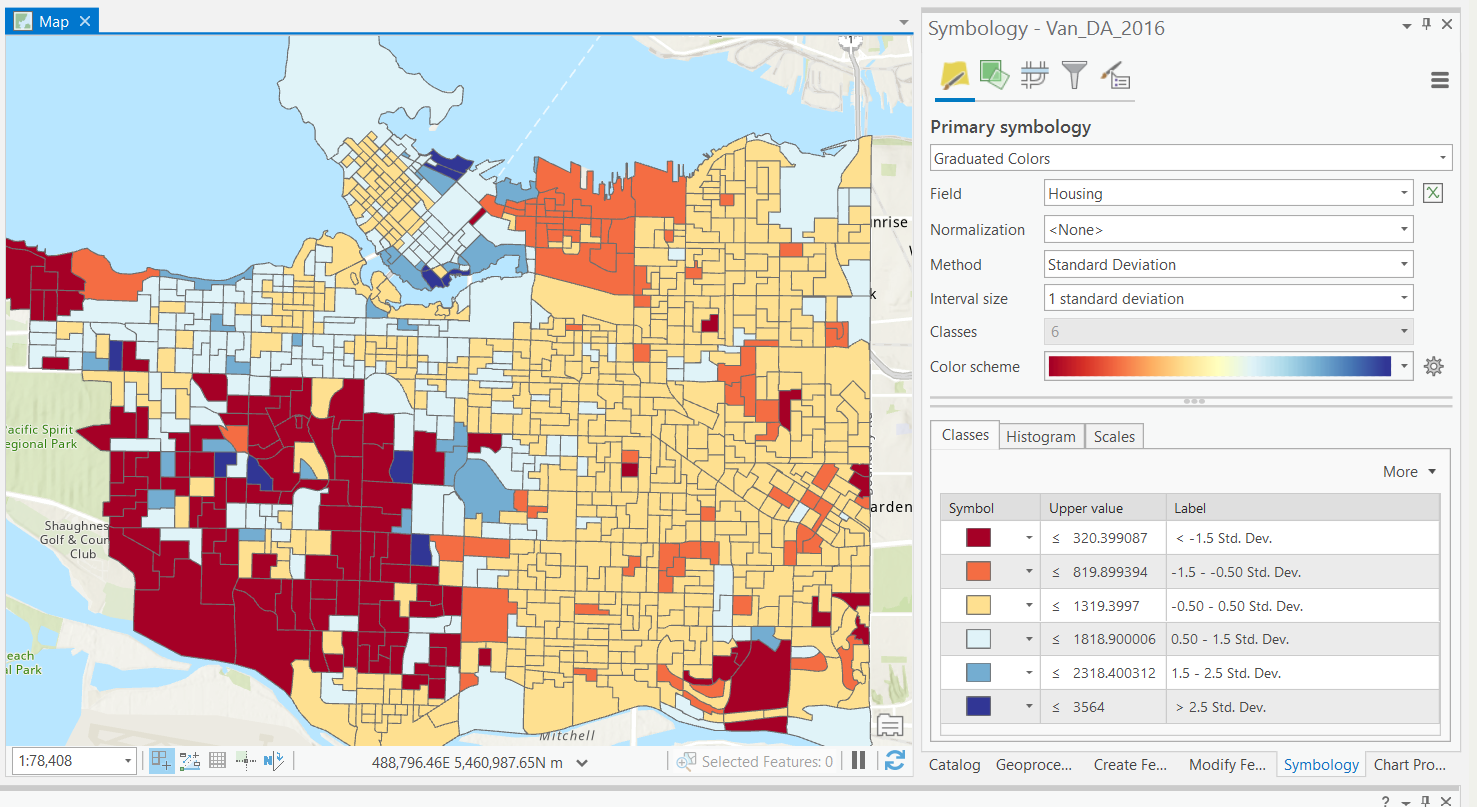
Standard Deviation
Informative to “experts”, but not accessible for all audiences.
- “Distance” from mean in standard deviations.
- Interval data: diverging color maps.
- Unsupervised: user defines number of bins.
Manual Breaks
Supervised: User defines break values.
- Allows us to choose more meaningful break values if necessary.
- Incorporate multiple factors
- Influence the way the data is perceived.
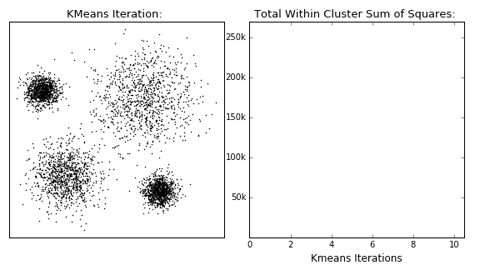
K-means
Algorithm uses random steps to group data into clusters.
- Unsupervised: user defines number of bins & iterations.
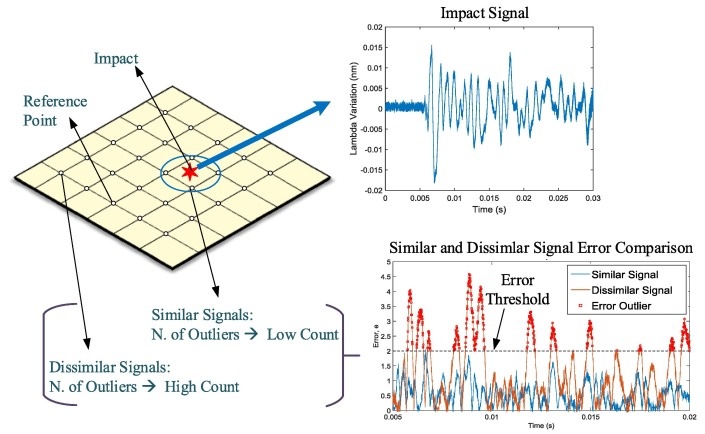
Median Absolute Deviation
Frequently used for automated outlier detection.
- Unsupervised: user defines error threshold.
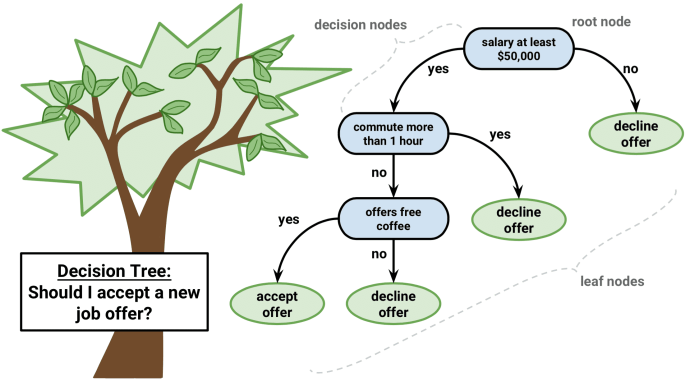
Decision Trees
Fit training data to user defined categories.
- Supervised: user provides training classes.
- Automated: algorithm determines break values.
- Risk of over-fitting
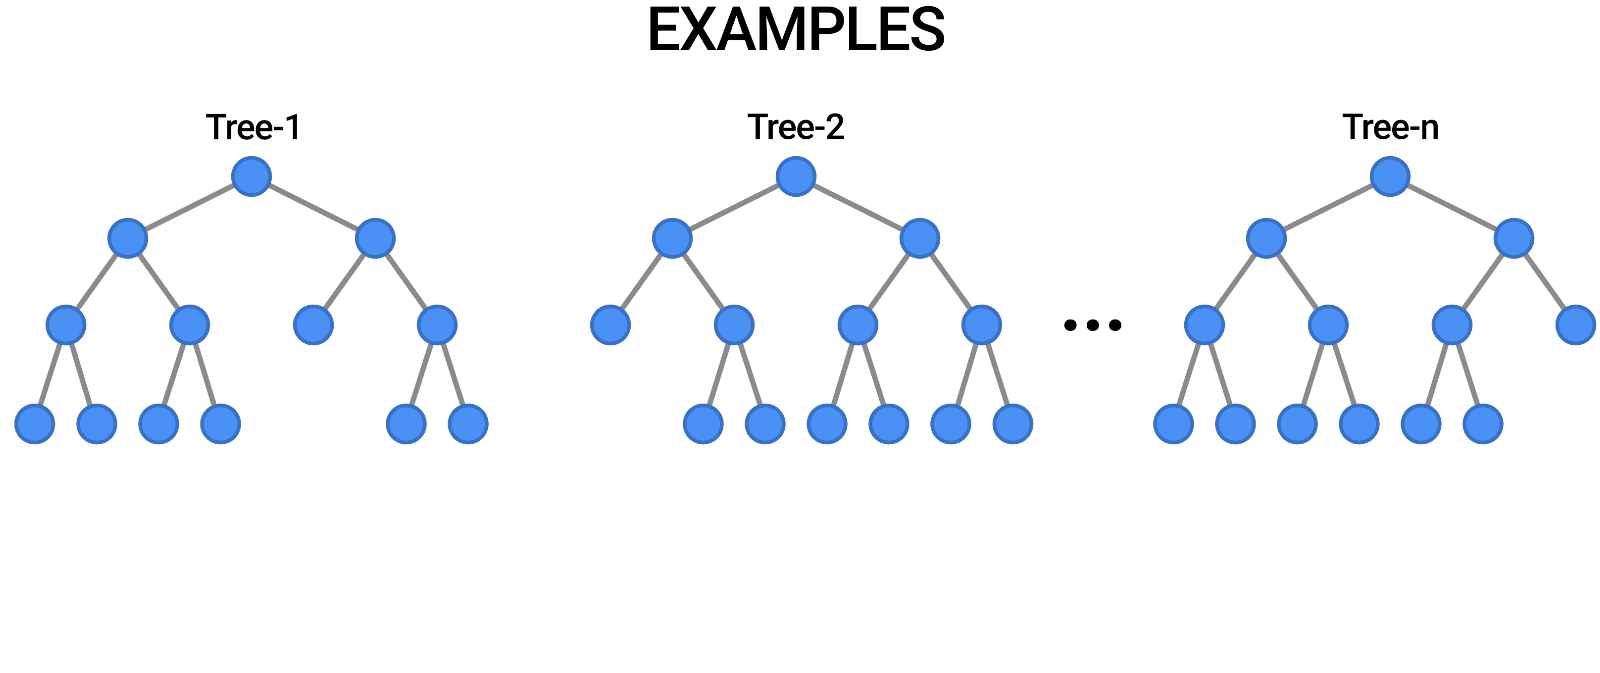
Random Forests
Multiple trees (>100) can be averaged to increase performance and generalization.
- Supervised: user provides training classes and “hyperparameters”.
- Automated: algorithm determines break values.
- Low risk of over-fitting
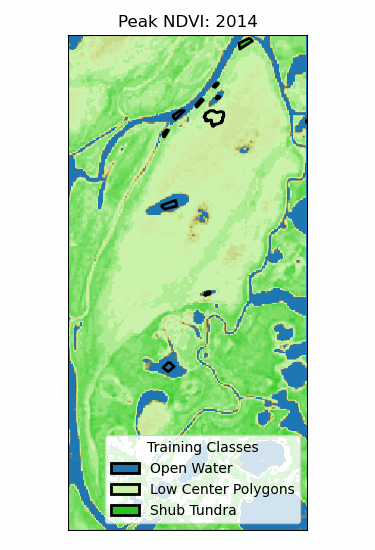
Landscape Classification
Multiple trees (>100) can be averaged to increase performance and generalization.
- Supervised: user provides training classes and “hyperparameters”.
- Automated: algorithm determines break values.
- Low risk of over-fitting
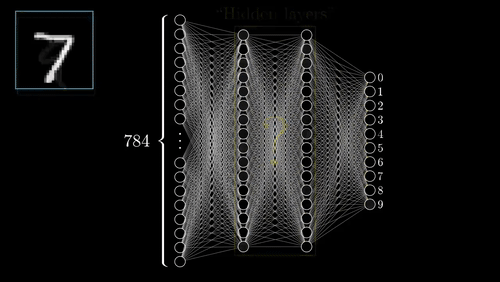
Neural Networks
One of the most complex methods, an algorithm learns complex relationships in dataset.
- Supervised: user provides training classes and “hyperparameters”.
- Risk of over-fitting
- Requires careful inspection