Clip
Often our data covers more area than needed, we can clip it to reduce the data volume.
- Clip Raster: cuts raster down to a bounding box.
- Max N/S & E/W extent of another layer (vector or raster) or manually defined.
Reclassify
When data is more complex than needed.
- Reclassify: creates a new output based on a classification scheme.
- Reassign values or simplify data to reduce data volume
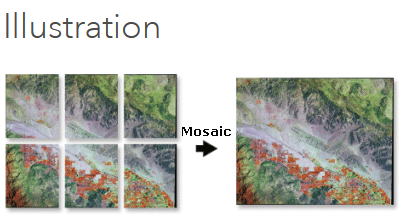
Mosaic
Sometimes the data comes in parts that need to be combined
- Mosaic: Combine multiple raster data sets into one.
- There are multiple approaches we can use.
Mosaic
Sometimes the data comes in parts that need to be combined
- Mosaic: Combine multiple raster data sets into one.
- There are multiple approaches we can use.
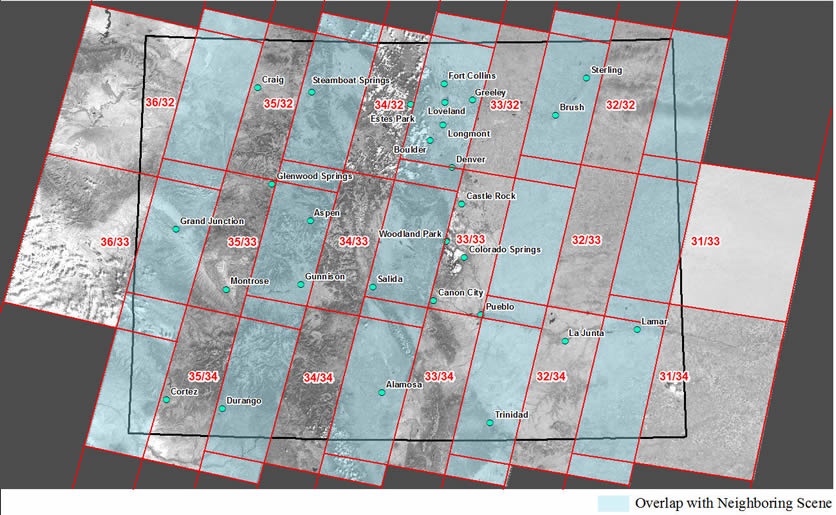
Often used to merge multiple satellite images
Proximity Analysis
Sometimes, we’re interested in looking at spatial relationships using raster data.
- Euclidean Distance: use this tool to calculate distance from the nearest feature or raster layer.
Raster Overlay
When we have multiple raster layers and we want to combine them to form a new output.
- Easy, efficient overlay
- Key advantage of the raster data model
- We have a few tools we can use for this

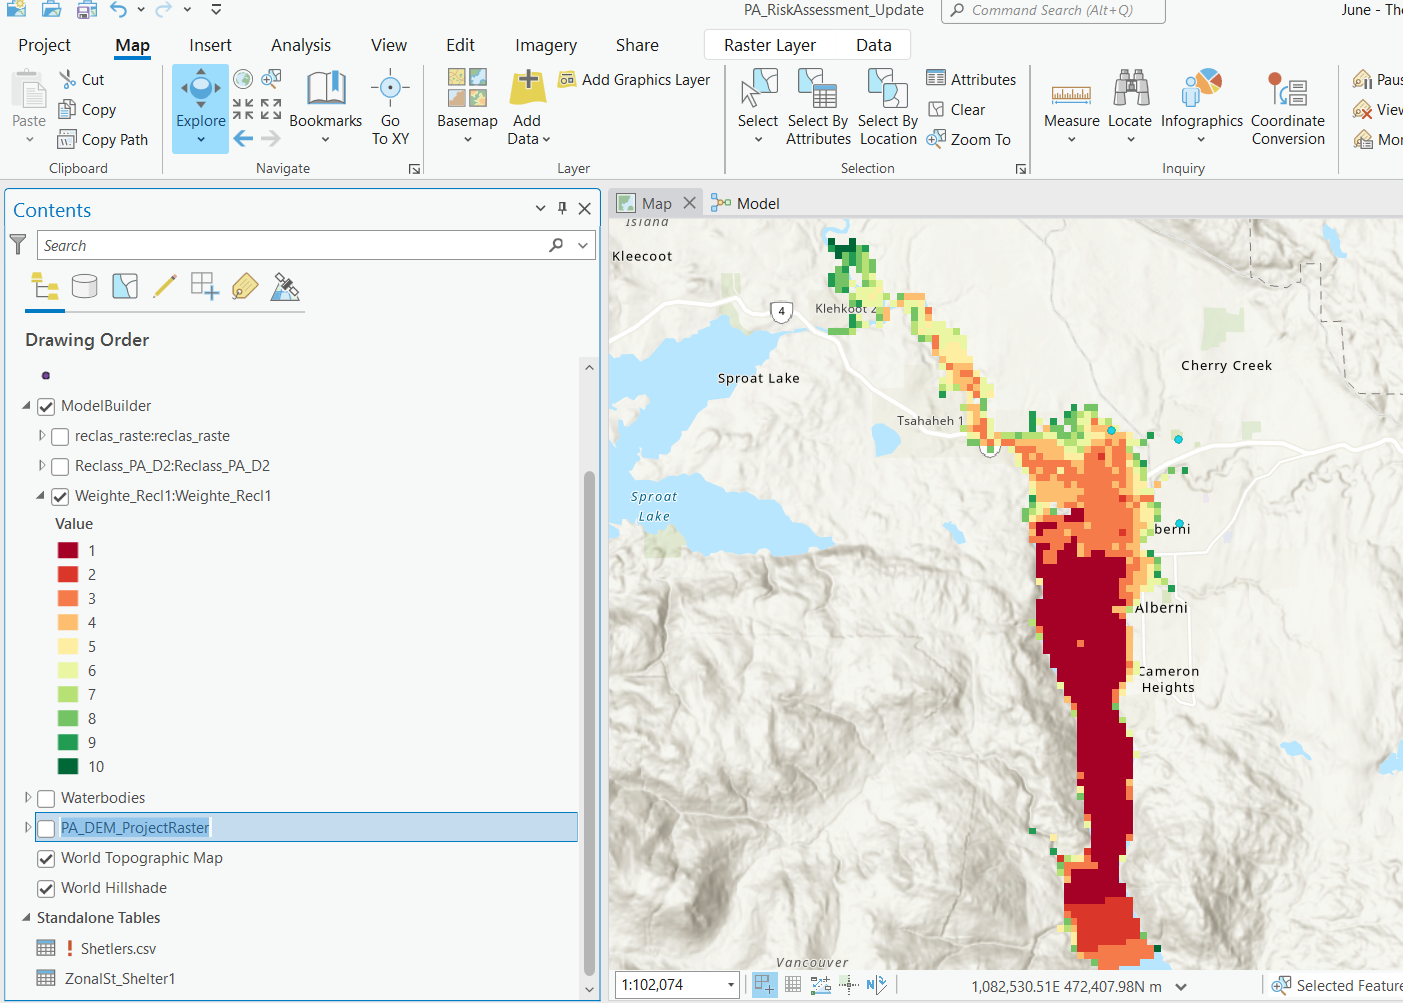
Weighted Overlay
Weights inputs for suitability analysis or risk assessment.
- Inputs must be discrete numbers
- Manually define weights and scale
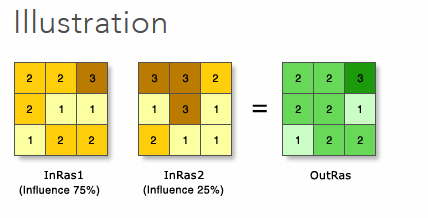
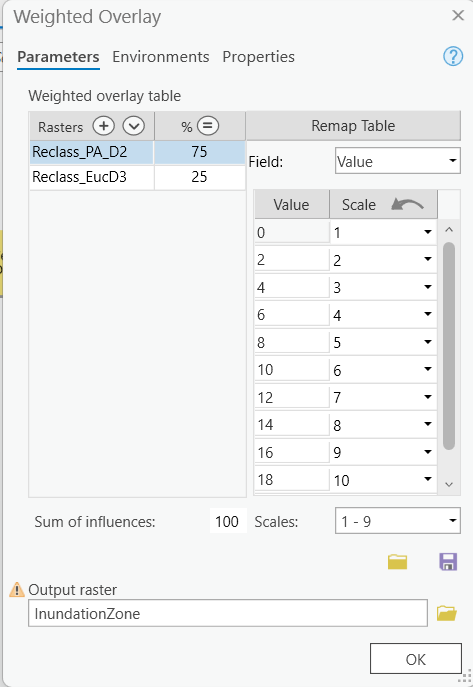
Weighted Overlay
Weights inputs for suitability analysis or risk assessment.
- Discrete outputs
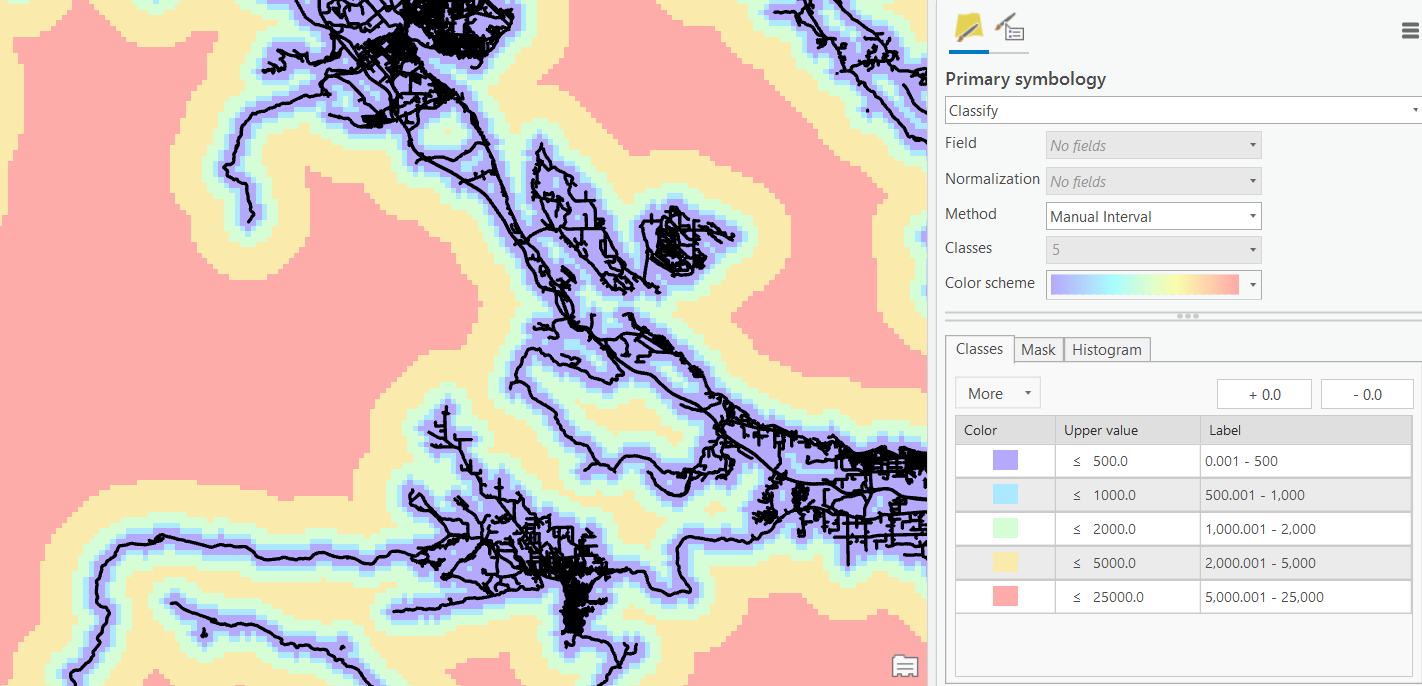
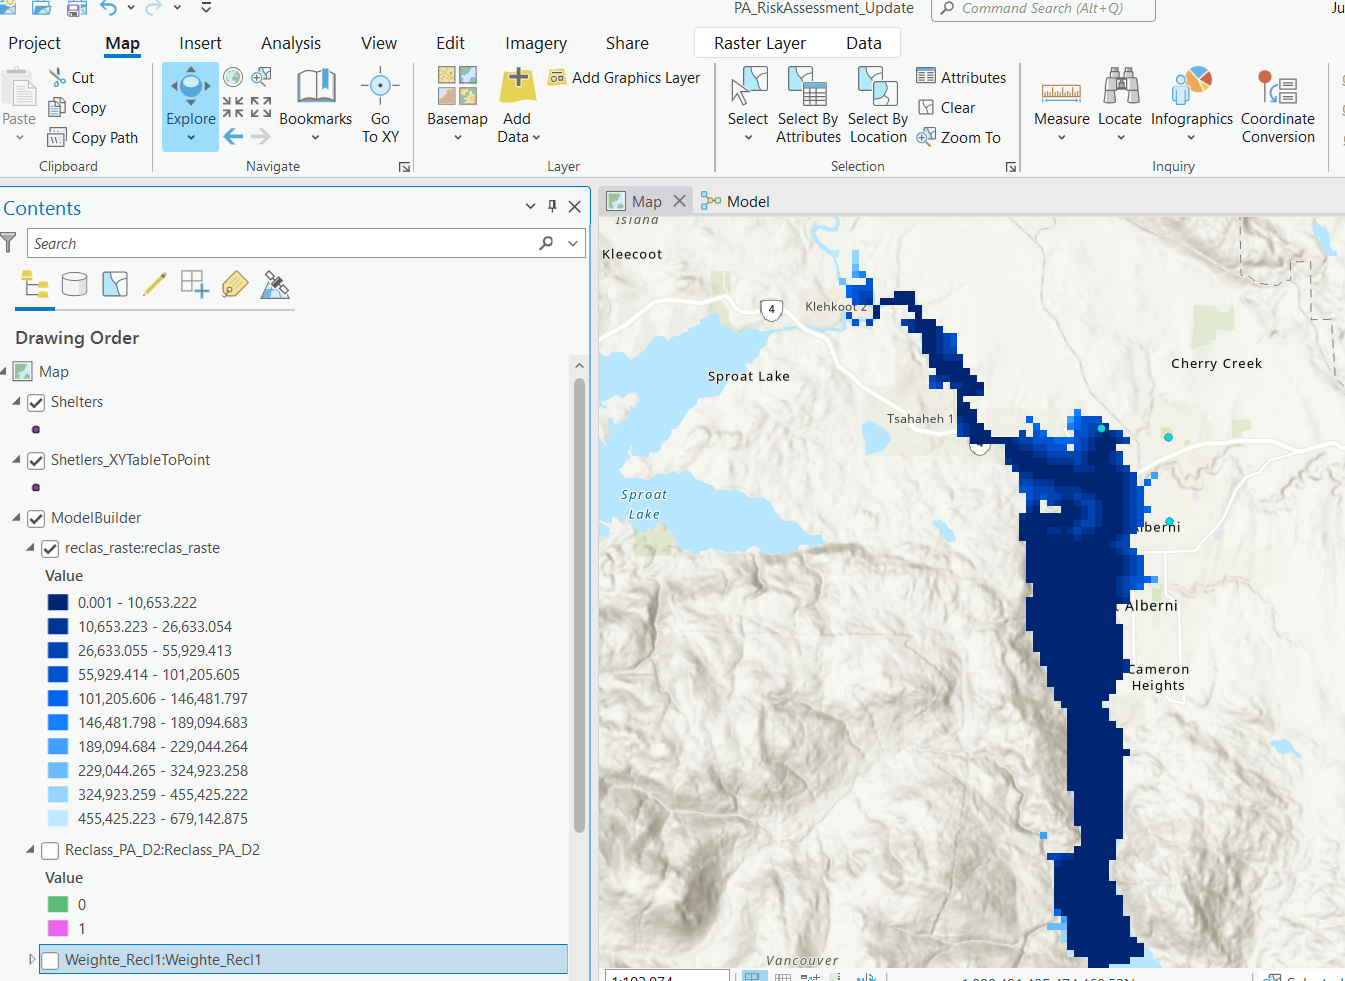
Raster Calculator
More general and flexible than weighted overlay.
- Outputs are more straightforward
- Because inputs are more explicit
- Can do weighted overlay among other tasks
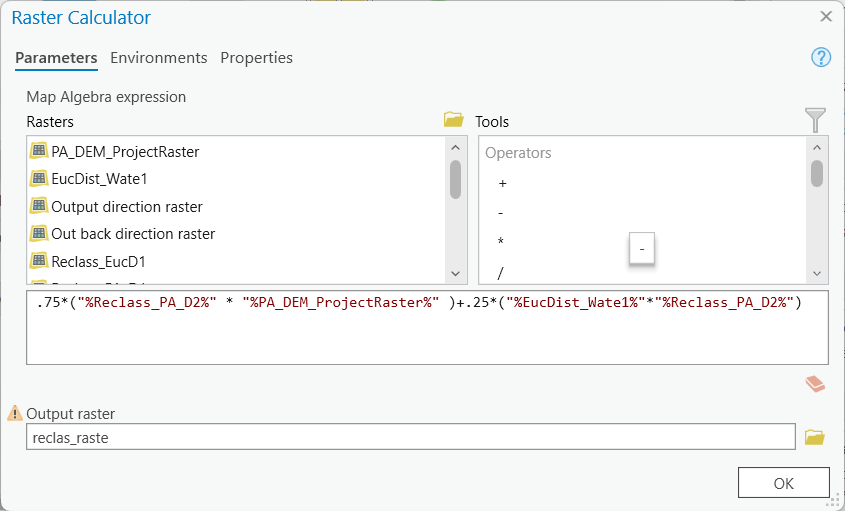
Raster Calculator
More general and flexible than weighted overlay.
- Continuous output
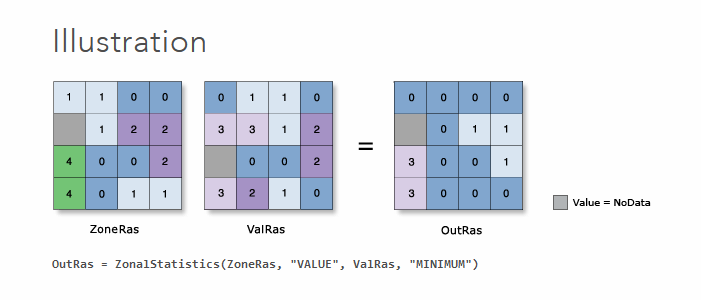
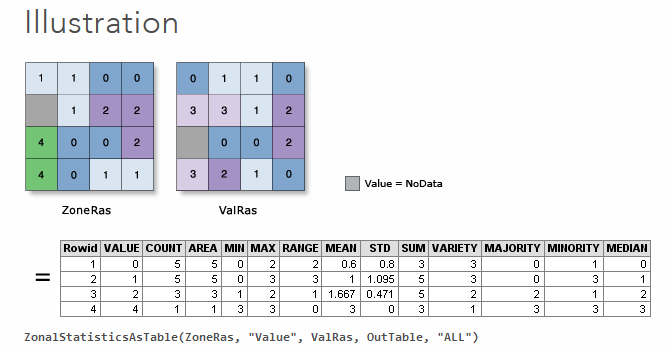
Zonal Statistics
Calculate statistics by region.
- The zone can be either a raster or vector layer.
- Zonal Statistics as Table generates a table containing multiple statistics by zone.
Surface Analysis
These tools are designed to analyze elevation surfaces.
- Slope: calculates the slope of a terrain surface
- The angle in degrees from a cell to it’s “lowest” neighbor
Surface Analysis
These tools are designed to analyze elevation surfaces.
- Aspect: calculates the direction a slope is facing
- North, southeast, west northwest, etc.
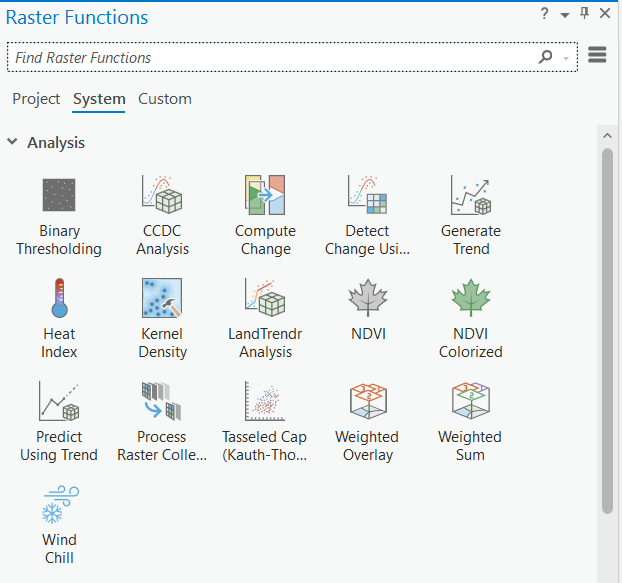
Raster Functions
ArcGIS Pro has an extensive toolkit of tools for more complex analyses.
- Many are beyond the scope of intro-level GIS
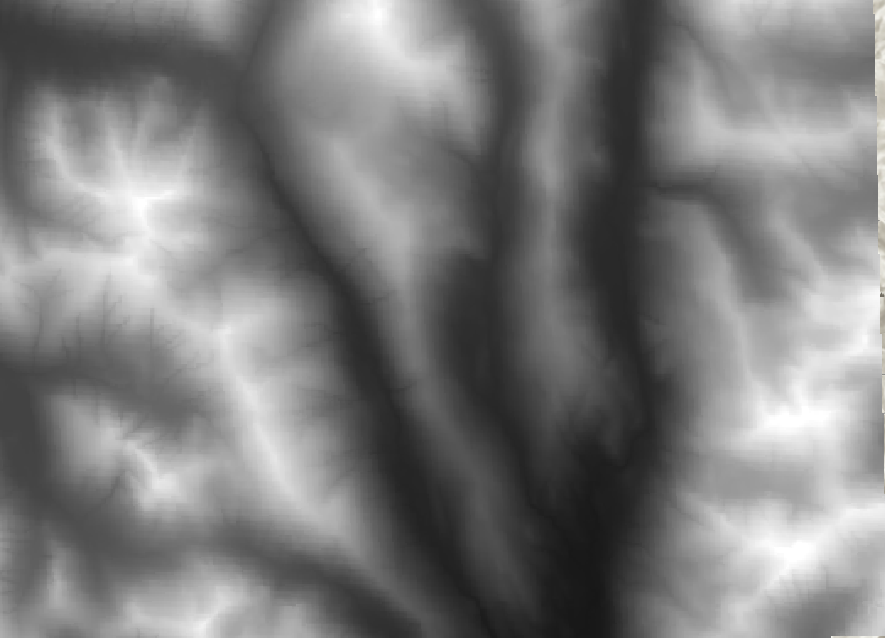
Hydrologic Modelling
The Hydrology toolset can be used to calculate stream flow.
- Use a DEM as an input
- Fill “sinks”
- Calculate flow direction
- Run flow accumulation

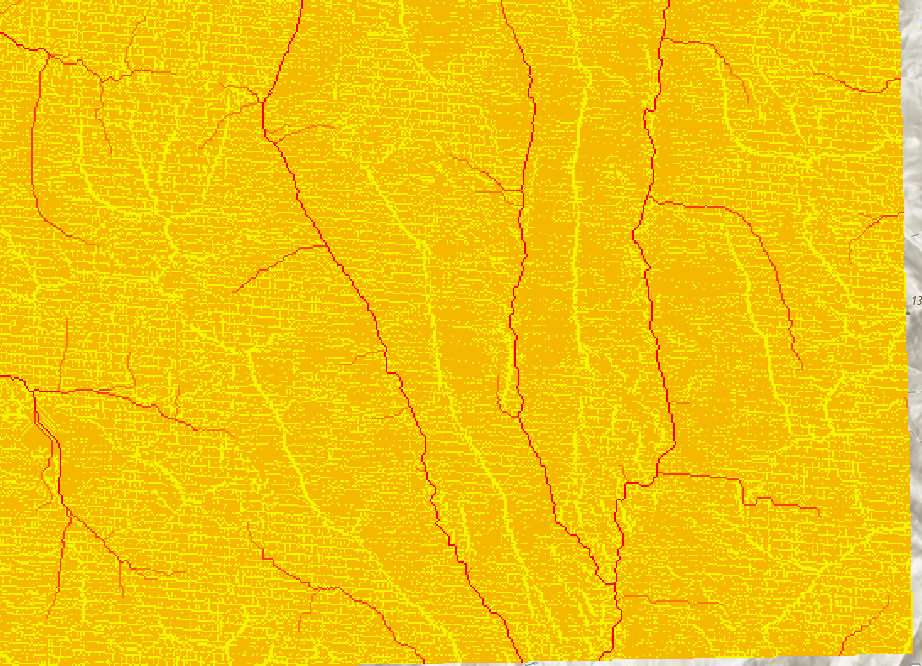
Hydrologic Modelling
The Hydrology toolset can be used to calculate stream flow.
- Use a DEM as an input
- Fill “sinks”
- Calculate flow direction
- Run flow accumulation
DEM Input
Hydrologic Modelling
The Hydrology toolset can be used to calculate stream flow.
- Use a DEM as an input
- Fill “sinks”
- Calculate flow direction
- Run flow accumulation
Accumulated stream flow output
Calculate NDVI
You can calculate NDVI directly in Arc
- Just give the red and near infrared bands from a satellite image
- e.g. Landsat8: Red (4), near infrared (5)
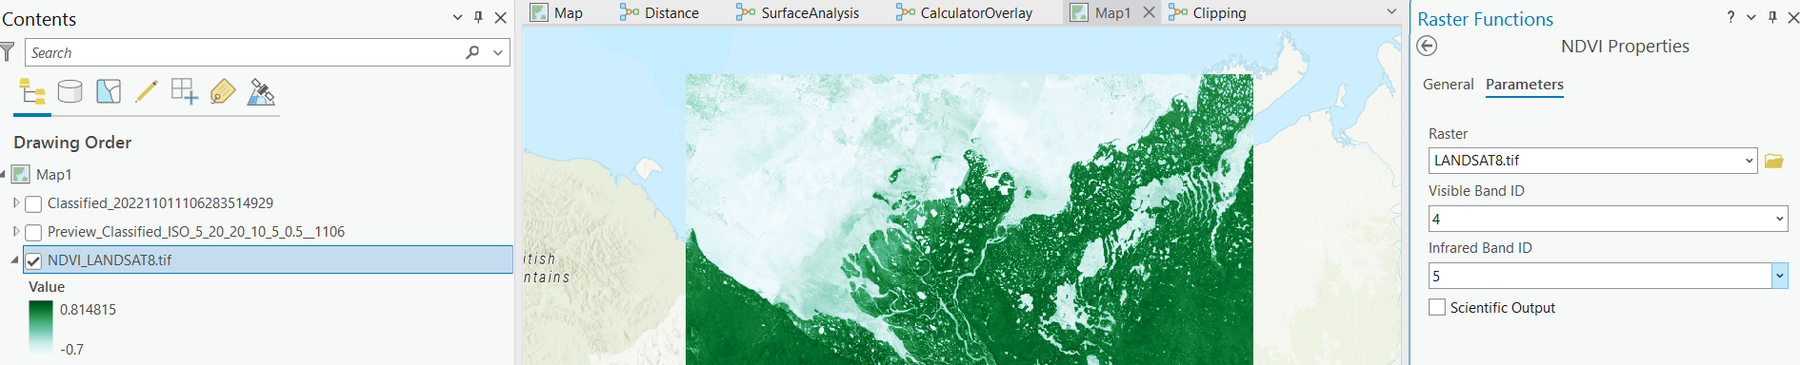
Image Classification
Supervised or unsupervised classification methods
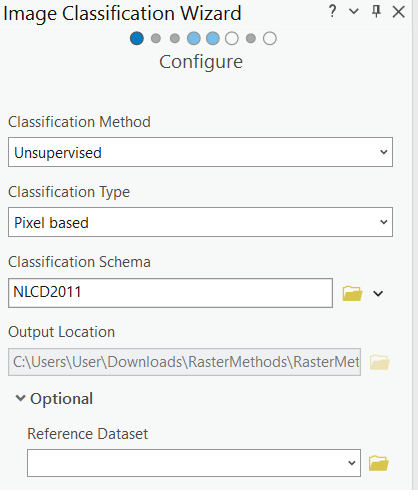
Image Classification
Supervised or unsupervised classification methods
