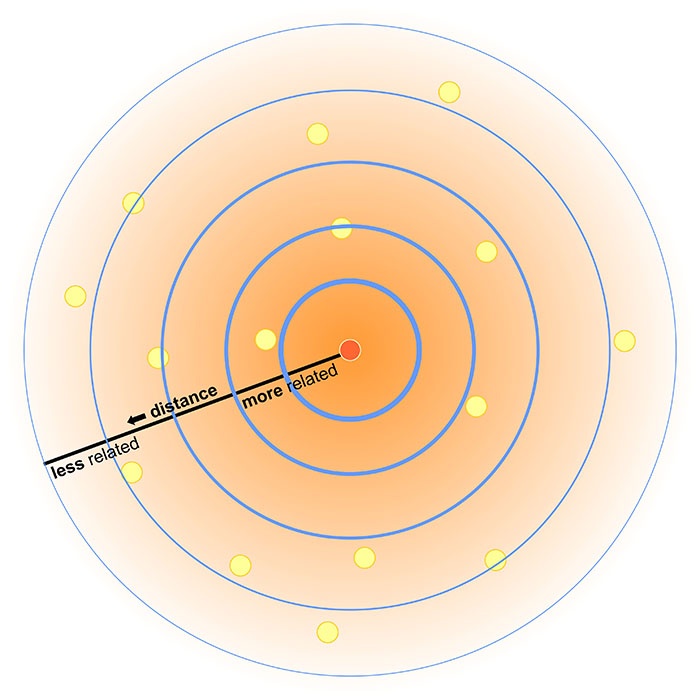
The First Law of Geography
Everything is related to everything else, but near things are more related than distant things.
- Object/areas near each other are more likely to be similar Objects/areas near that are distant from each other are more likely to be different
- This aspect of nature keeps coming in GIS!
Random Sampling
In theory, a random sample is best. Its the “gold standard”.
- Unbiased: each location has equal chance of selection
- Easy to do, randomly select 𝑥,𝑦 coordinates
- A key assumption of many statistical tests
Random Sampling
Can be difficult to implement in practice.
- Chance that all samples miss important features
- May be barriers to access
- Remote or rugged terrain
- Private property
- Systematic under-responses
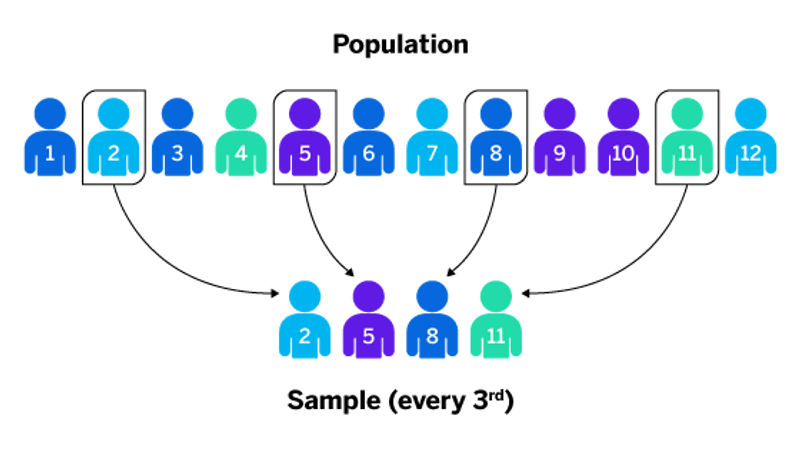
Systematic Sampling
A random starting point is chosen and a fixed sampling interval is used.
- Randomly select first of 3 students
- Select every 3rd after
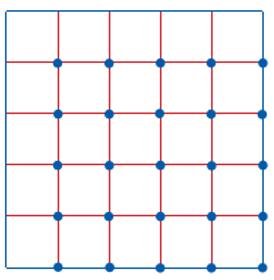
Systematic Sampling
A random starting point is chosen and a fixed sampling interval is used.
- Choose a random starting point
- Then draw equally spaced grid
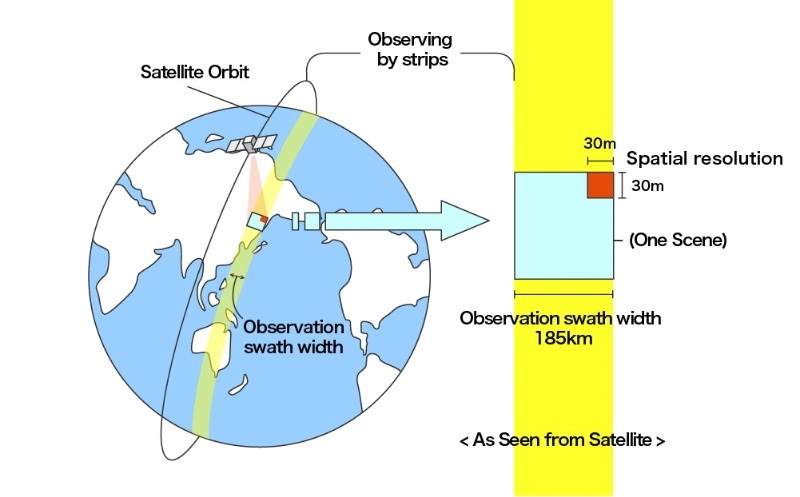
Systematic Sampling
A random starting point is chosen and a fixed sampling interval is used.
- Premise behind satellite data collection
- Often good for continuous fields
- eg., land cover
- Often good for continuous fields
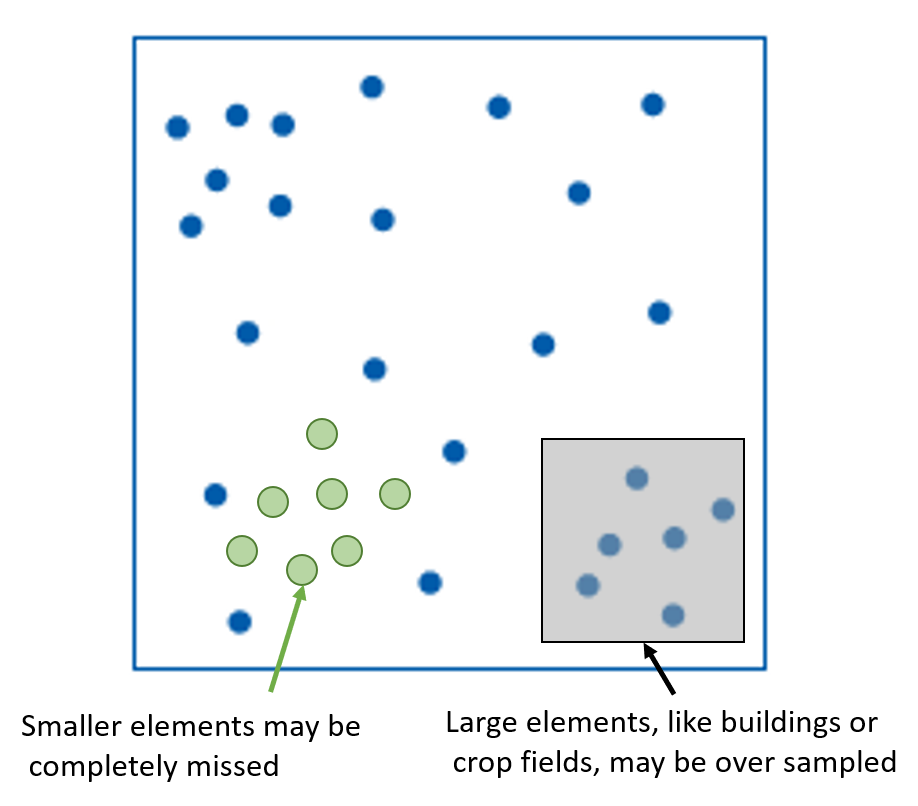
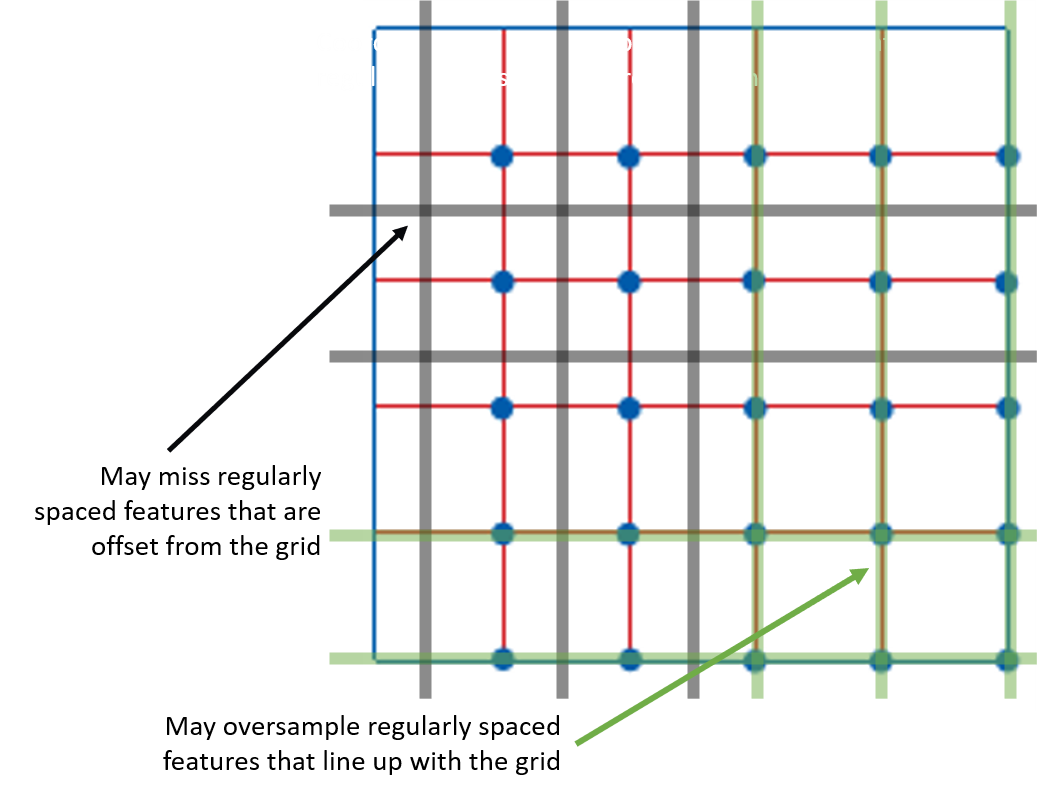
Systematic Sampling
A random starting point is chosen and a fixed sampling interval is used.
- Not ideal for discrete objects that exhibit periodicity
- City blocks, Roads, etc.
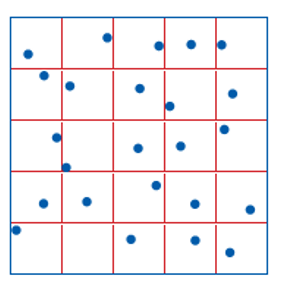
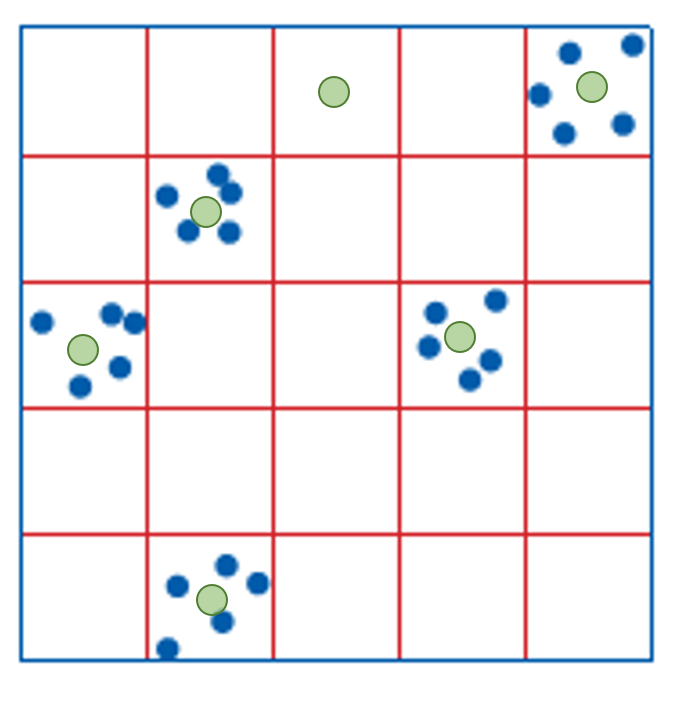
Stratified Sampling
Address the issues with systematic sampling by sampling at random locations, while applying a “systematic bias”
Create a systematic sampling grid, then take random samples within cells
Can avoid over/under sampling regularly repeating features
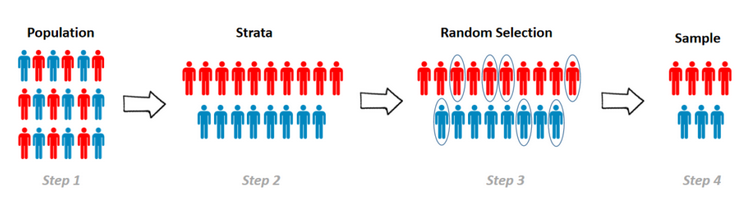
Stratified Sampling
Divide a population by certain attributes, then take random samples from sub-populations
- Account for important factors
- Gender, race, age, political party, etc.
Cluster Sampling
Intense sampling of features in clusters around a number of selected locations
- Locations can be selected for specific features, e.g.,:
- Shopping centers
- Known history of invasive species
- Or, locations can be selected at random across the grid
Cluster Sampling
Intense sampling of features in clusters around a number of selected locations
- More efficient use of time and resources
- May not be representative
Transect Sampling
Commonly used along line features like roads & rivers.
- Focused effort on features of interest
- Requires understanding of spatial structure for maximum effectiveness
![]()
![]()
How Many Samples?
The number of samples required is a function of how similar units of that population are.
- Spatial structure can vary wildly across a landscape
- Knowledge of your study area will help to establish how to best sample
- Maximize returns minimize effort
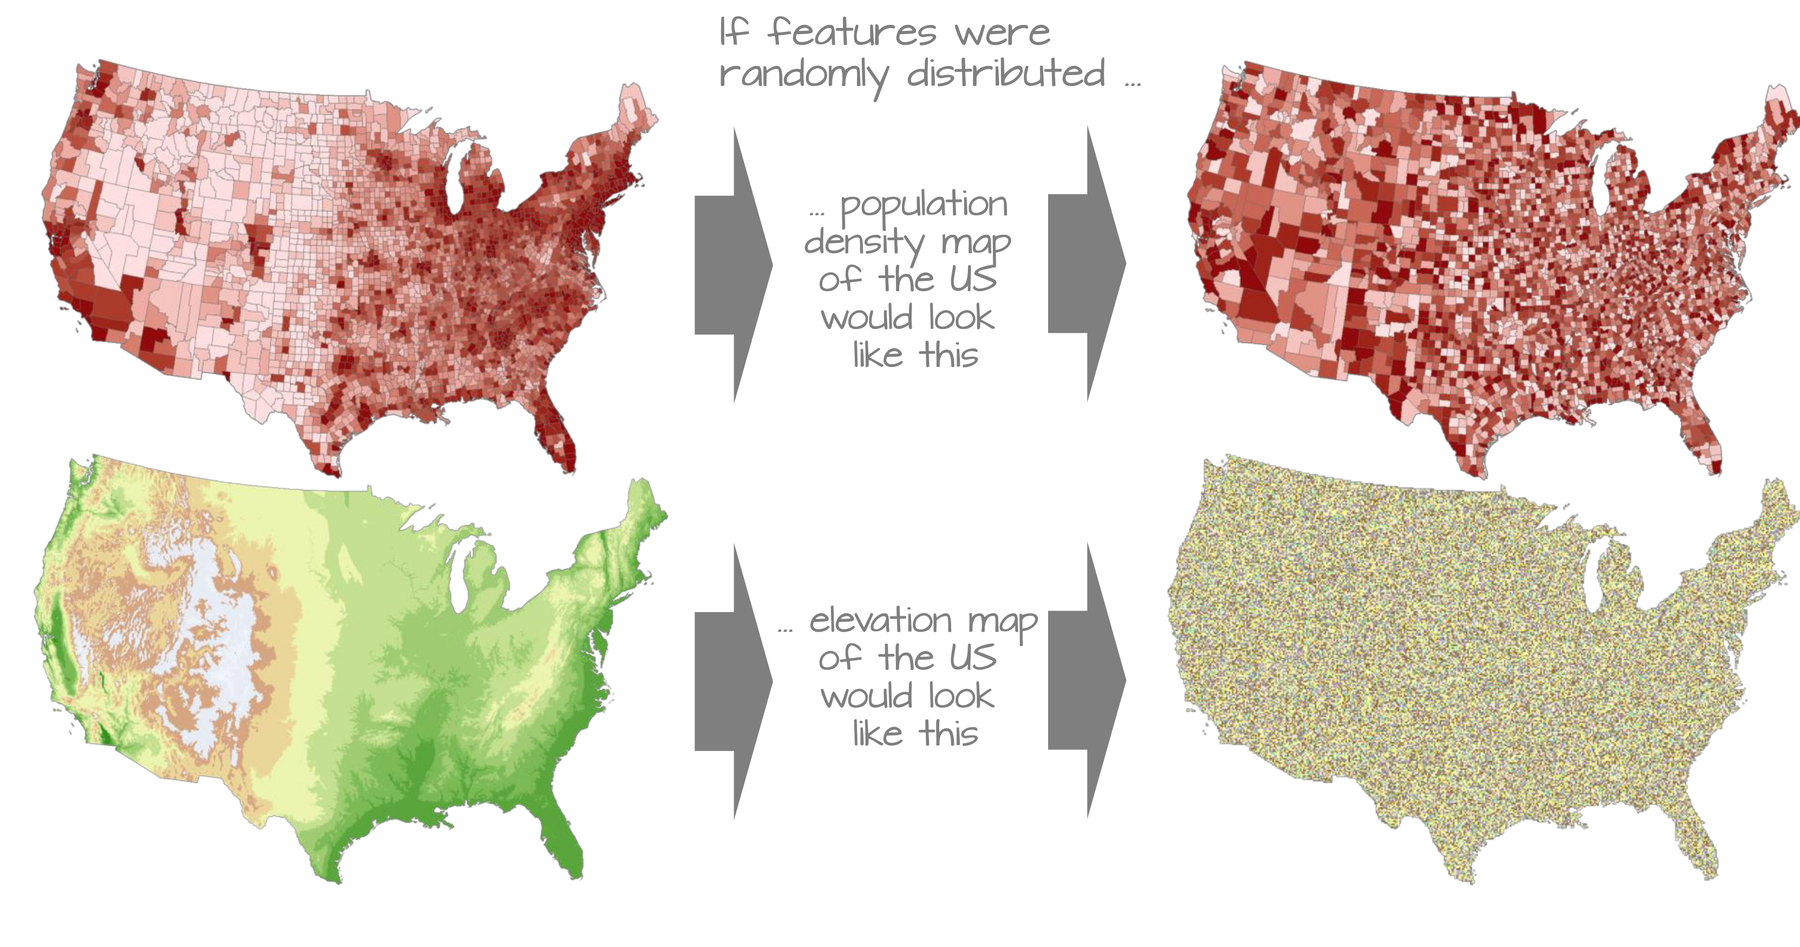
Spatial Autocorrelation
When the values of objects are related to the values of nearby objects.
- If you know the value of one object, you can make a reasonable guess at the value of nearby objects
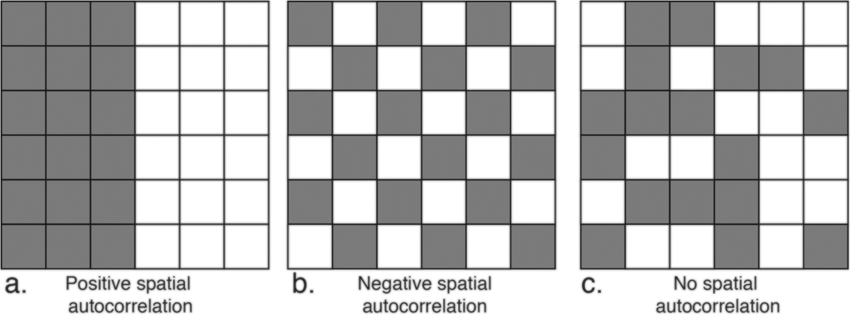
Spatial Autocorrelation
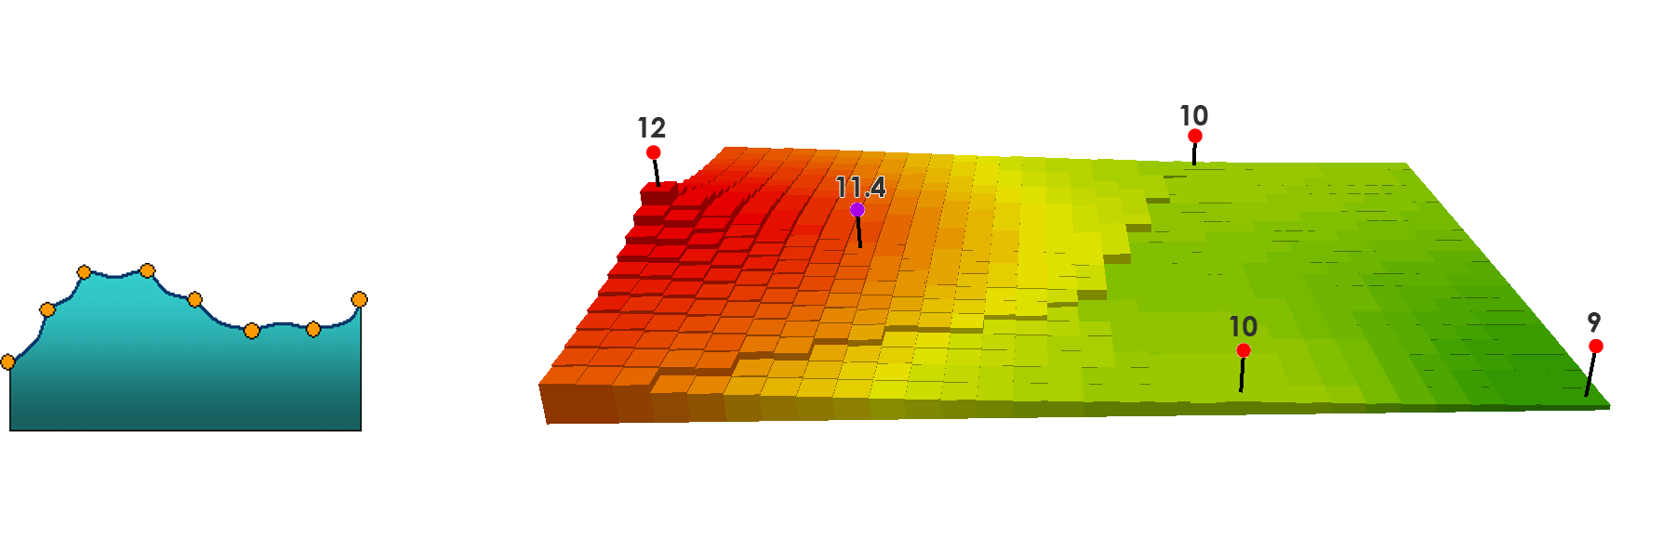
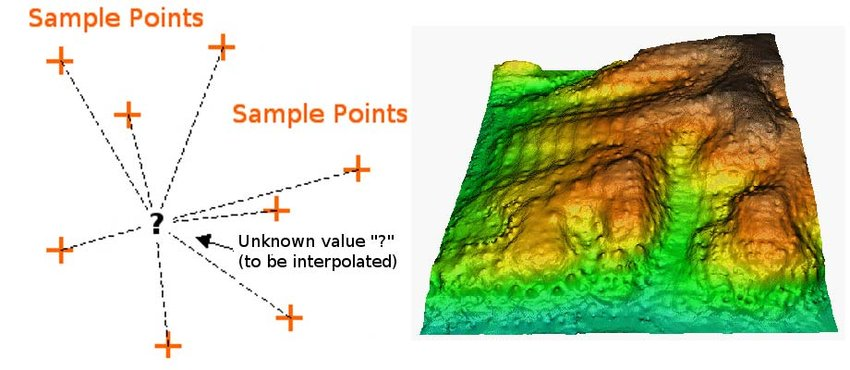
Spatial Interpolation
Spatial interpolation only makes sense for a continuous field with numeric values.
- Rainfall, temperature, pressure, elevation
- Estimate between measured locations
- Can be problematic with qualitative data
Inverse Distance Weighting
Calculates cell values based on nearby observations.
- Weight cells by distance from observation points
- Mathematical expression of Tobler’s Law
Inverse Distance Weighting
Best applied to discrete samples of continuous quantitative variables.
- Elevation
- Temperature
- Precipitation
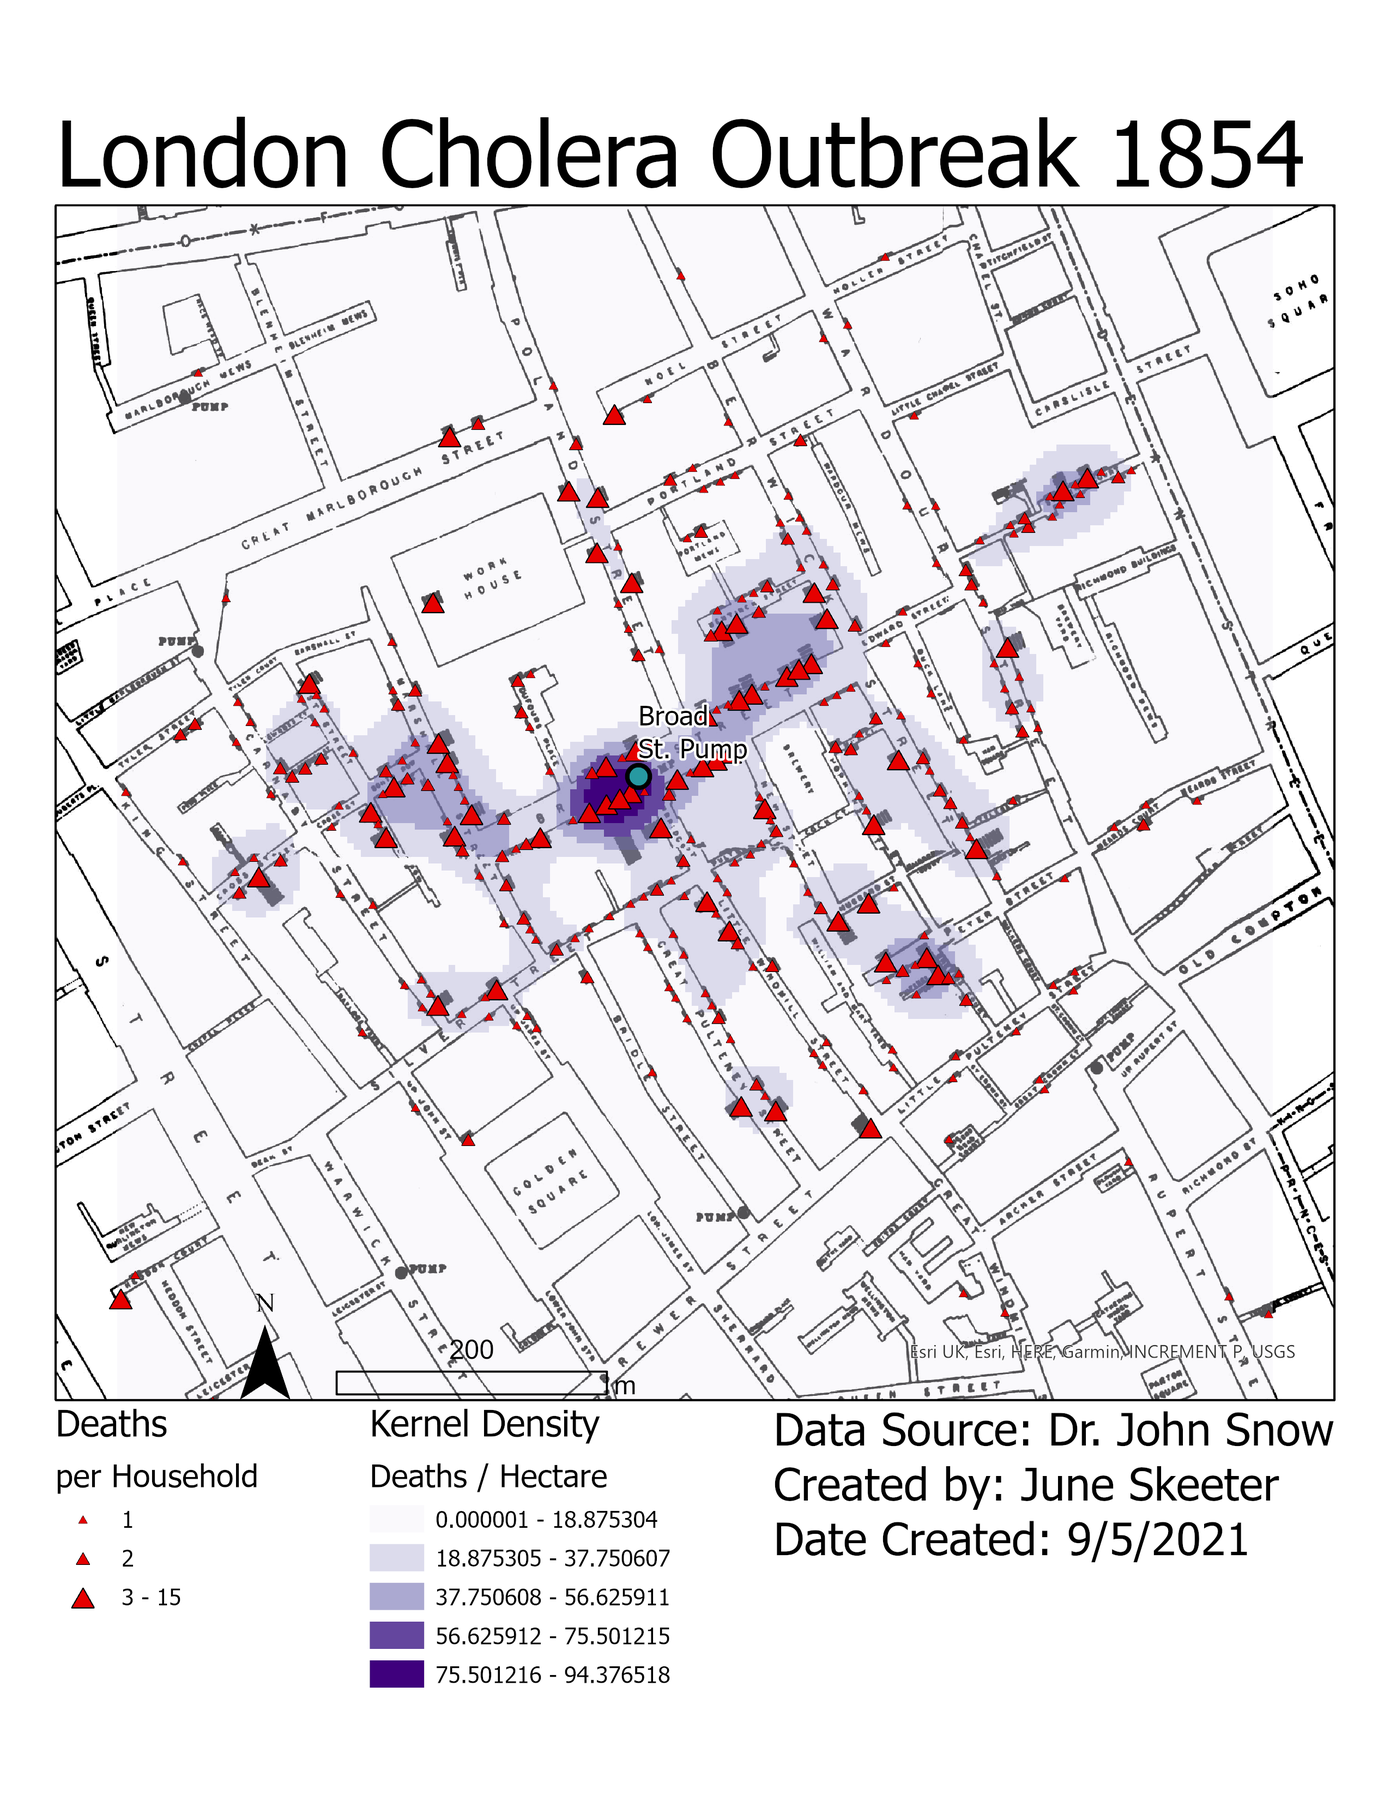
Kernel Density
Calculates the “density” of discrete objects and converts to a raster surface
- Probability of occurrence across space
- Weight by “value” of points
- Often applied to counts of qualitative data
- Disease outbreaks & crime data