Raster Data Model
Represents space continuously:
- Rectangular grid of equally sized cells
- Each cell only has one value
Raster Data Model
Multiple attributes, require multiple bands
- Standard color photos have three bands:
- Red, green, & blue
- LANDSAT8 has 11 bands:
- “False Color Images”
- Spectral Indices (NDVI)
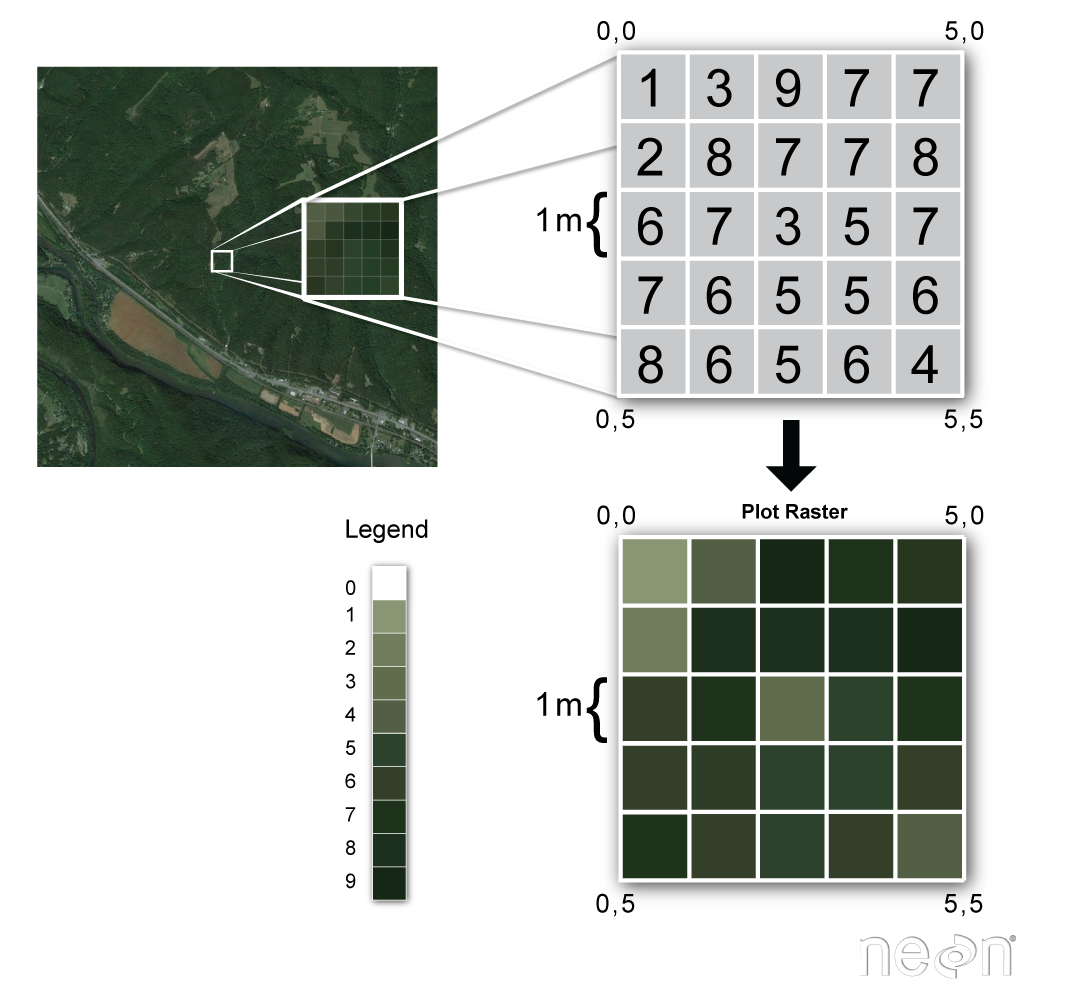
Resolution vs. Extent
Resolution (aka cell size) is the smallest resolvable feature. Extent (aka domain) depends on number of rows and columns along with the cell size.
1 m cell size
5 rows x 5 columns = 25 cells
Covers 5 m x 5 m = 25 m2
Mixed Pixel Problem
One cell = one value. What if it covers multiple values?
A: Winner take all
B: Cell center
Other options?
- Containment: value of interest is present
- e.g. invasive species presence
![]()
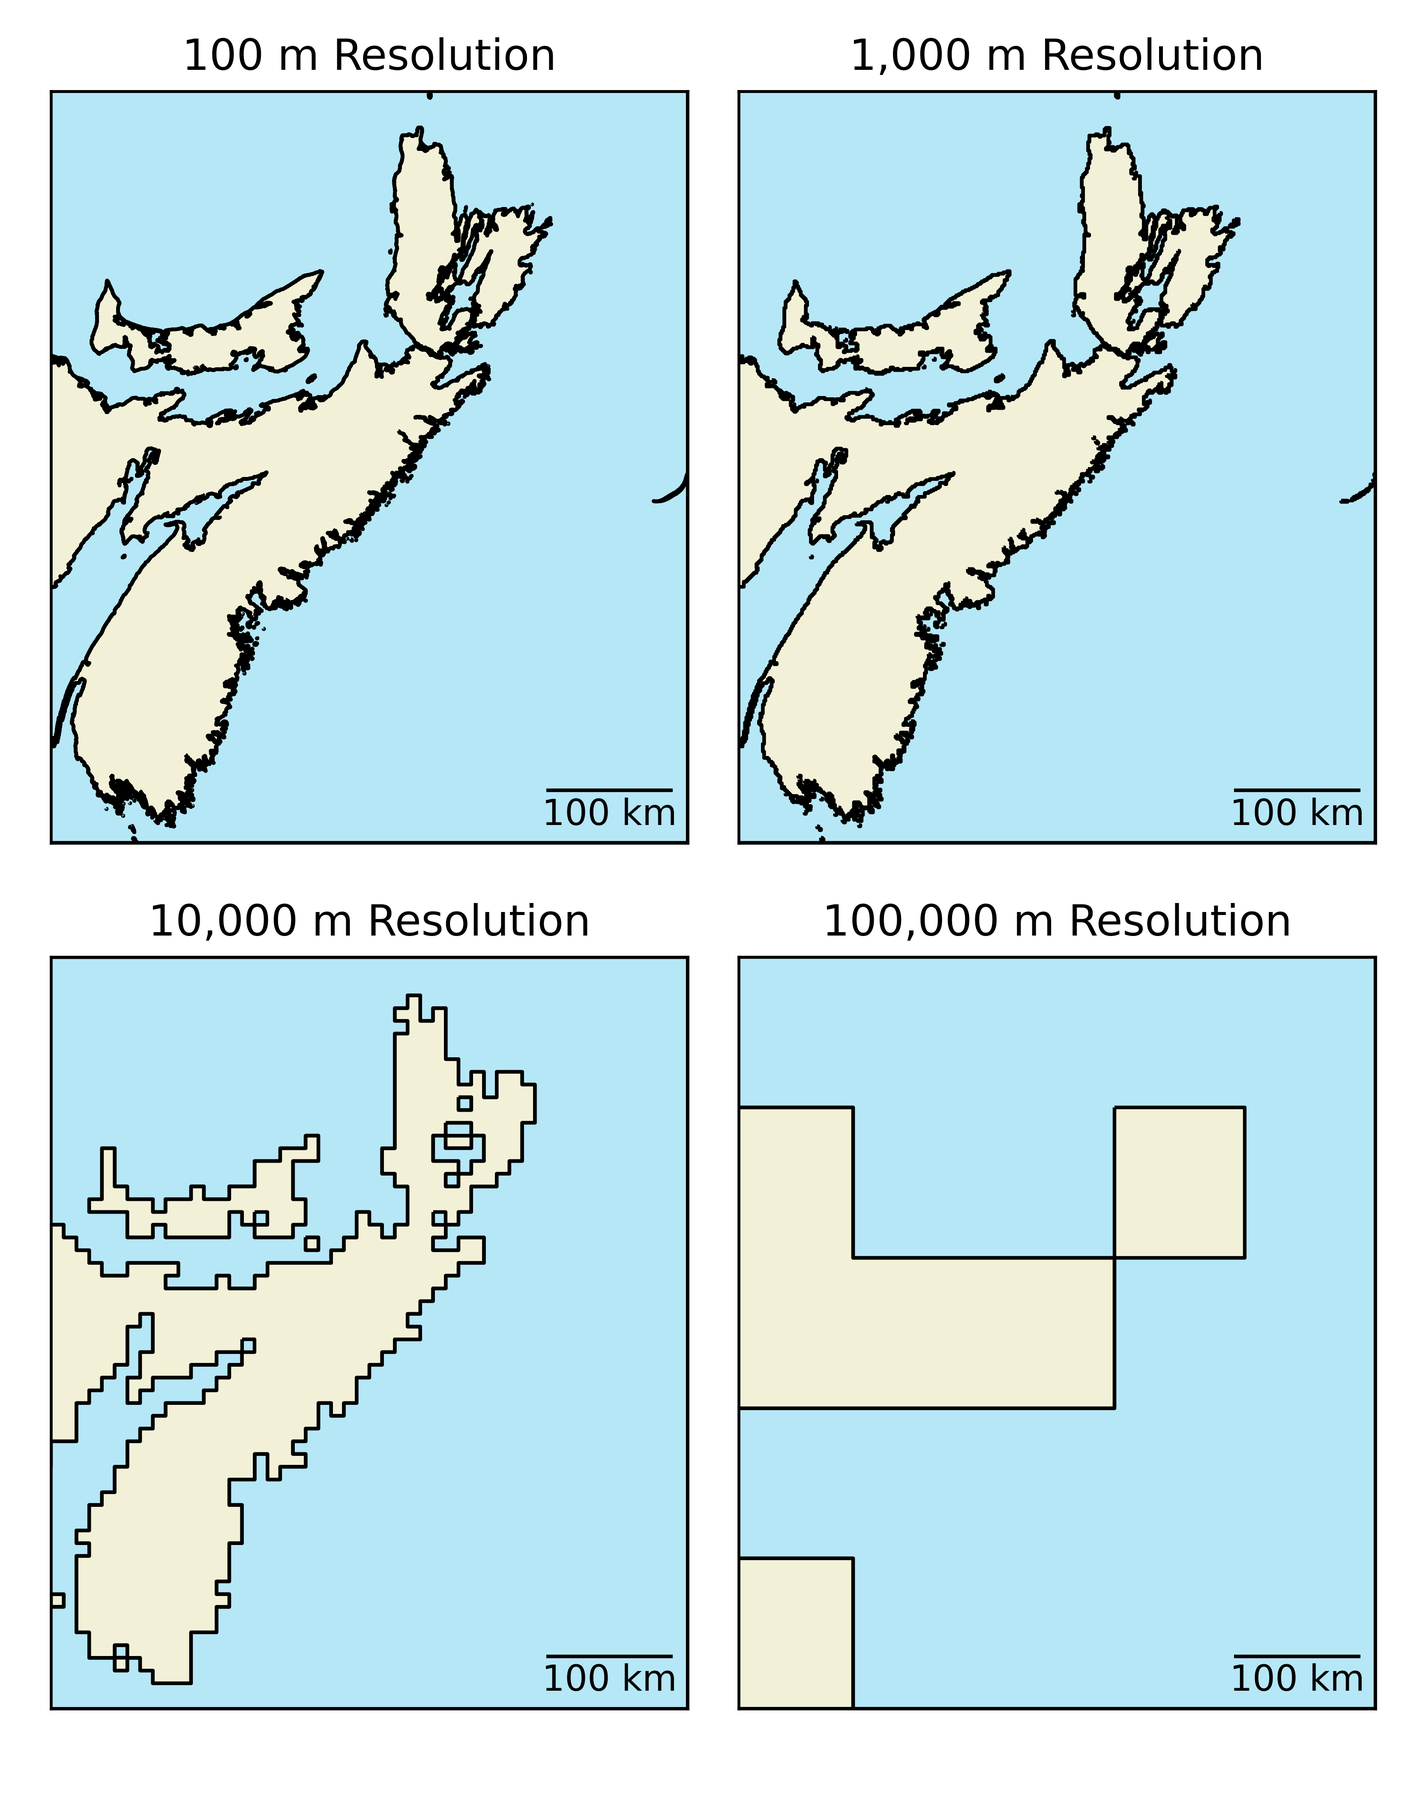
Implications
Loss of information during rasterization.
- “Bigger” issue for larger cells
- At some point features become unrecognizable
- Higher resolution = larger file
- For equivalent areas
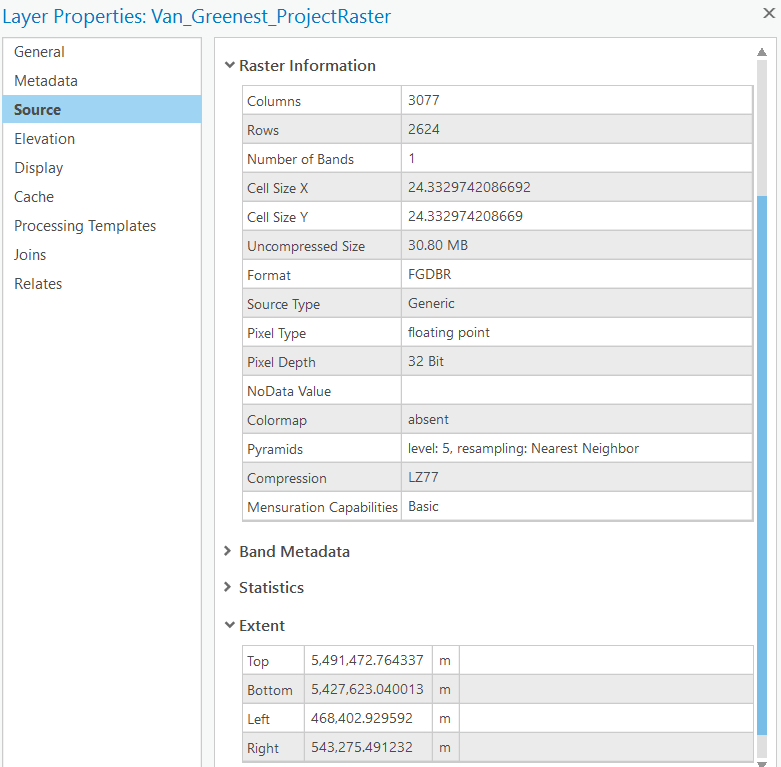
Metadata in ArcPro
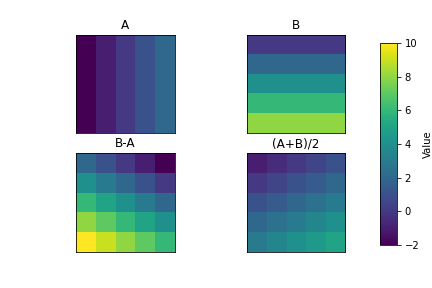
Raster Overlay
Raster data can be used to evaluate algebraic expressions easily and efficiently.
- A: Winter Temperature
- B: Summer Temperature
- Range: B-A
- Average: (A+B)/2
Raster Calculator
- Perform simple calculations incorporating one or multiple layers
- Ideally, layers should have the same resolution and extent
- Output will be restricted to “smallest” extent
Raster Calculator
- Perform simple calculations incorporating one or multiple layers
- Ideally, layers should have the same resolution and extent
- Output will be restricted to “smallest” extent
Raster Calculator
- Perform simple calculations incorporating one or multiple layers
- Ideally, layers should have the same resolution and extent
- Output will be restricted to “smallest” extent

Raster Calculator
- Perform simple calculations incorporating one or multiple layers
- Ideally, layers should have the same resolution and extent
- Output will be restricted to “smallest” extent
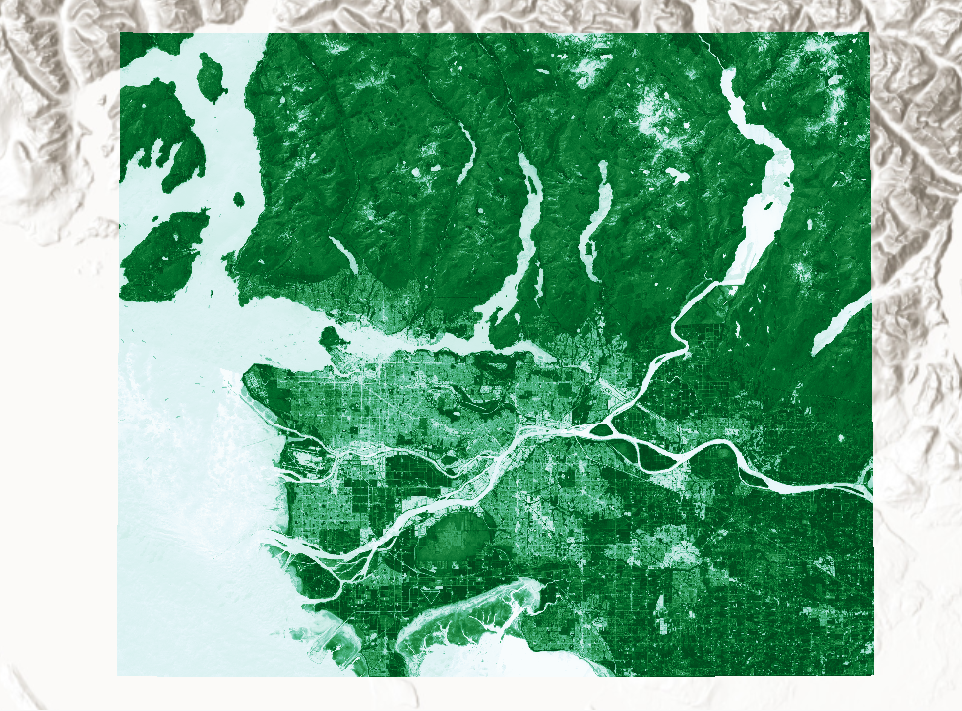
Monitoring Vegetation
The lines on the chart below are referred to as a spectral reflectance curves.
\(NDVI = \frac{(NIR-Red)}{(NIR+Red)}\)
- Green vegetation has different reflectance than soil and water
