What is Data?
What is a Phenomenon?
Phenomenon: a fact or situation that is observed to exist or happen, especially one whose cause or explanation is in question.
- A lightning strike
- A coastline
- A country
- A dog on a kayak!
- Anything and everything are phenomena!


Types of Phenomena
Discrete Objects
- Distinct boundaries
- Chat can be exactly measured
- Finite
- They are countable and cannot be infinitely subdivided
Continuous Fields
- Everywhere has a value
- They are not countable and can be infinitely subdivided
Types of Phenomena
When is a phenomenon discrete or continuous?
- To an extent, it depends on our perspective and the scale of our analysis.
- Many phenomenon are a bit of both.
Lightning
- A strike is a discrete object
- What about a lighting bolt ...?
- Doesn't really have clearly defined boundaries?
- Sort of continuous
- Strike frequency is a continuous field
- Everywhere has a frequency of lighting strikes
- Even the absence of lighting strikes, is still a frequency of strikes
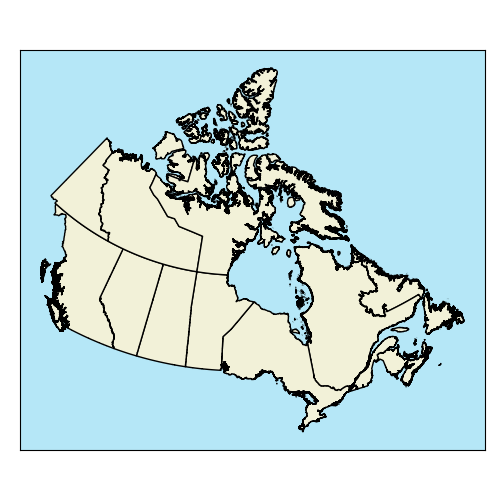
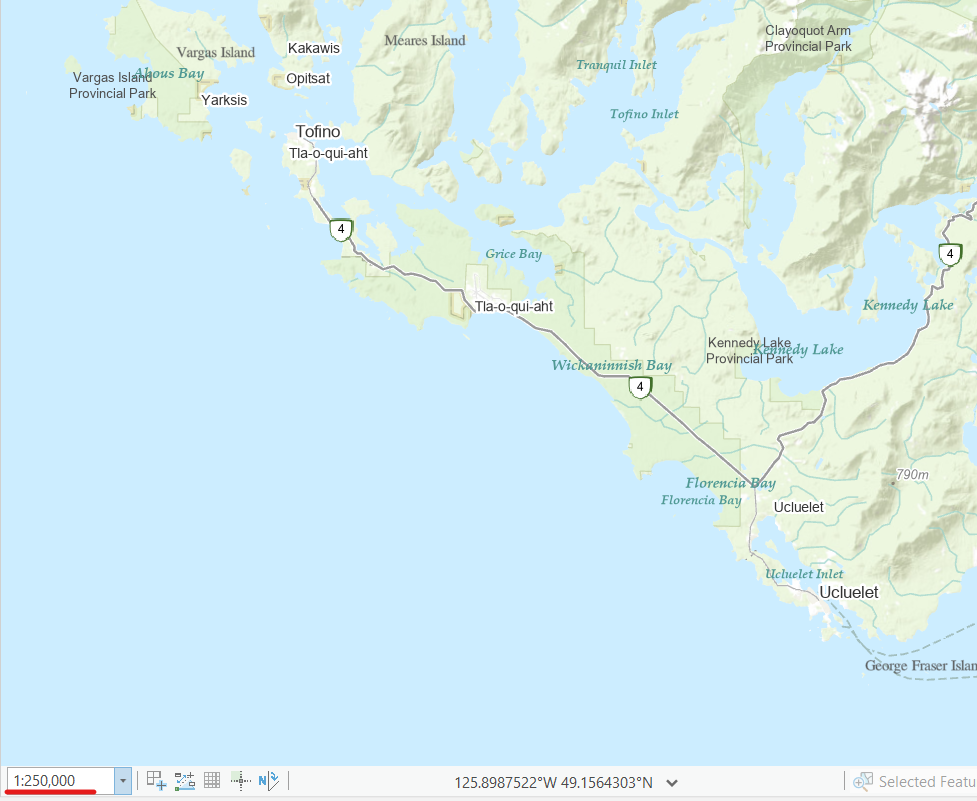
A Coastline
- Continuous field at large scale
- Tides & waves
- Where is the exact boundary?
- Discrete object at small scale
- Zoom out and the tides/waves don't really matter
- Its easy to draw a static boundary
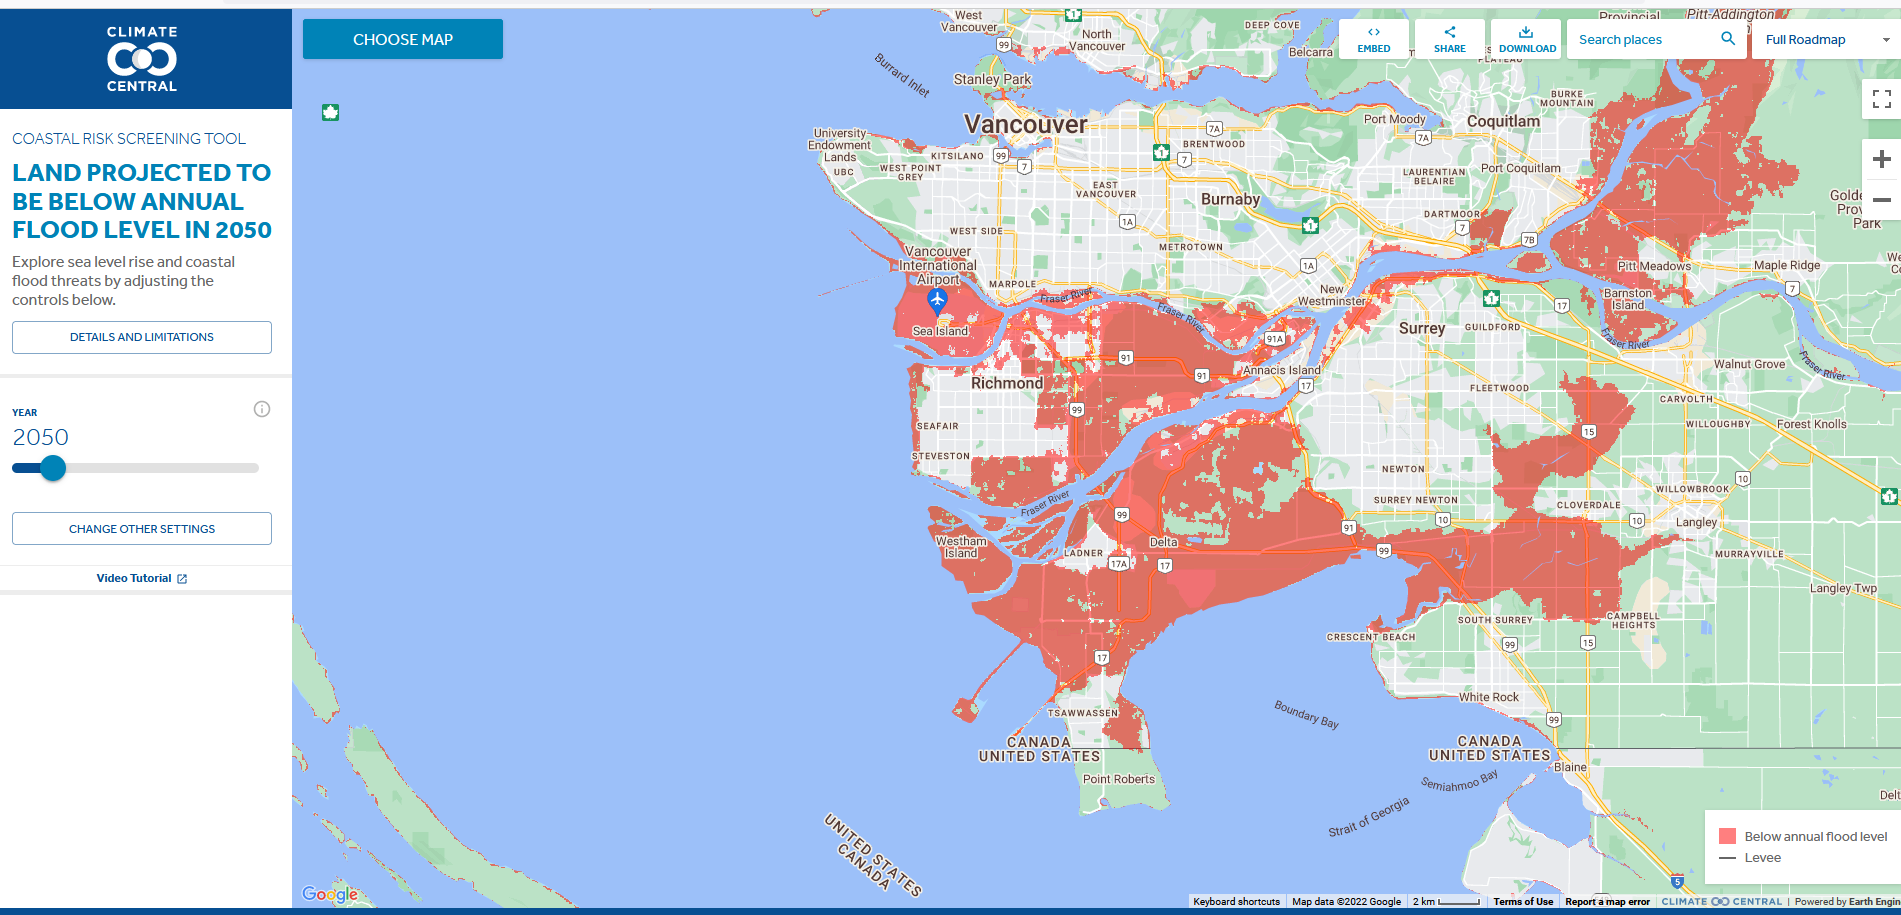
- Unless you change the time scale
- Until you start thinking about the long term :(
Types of Phenomena
Most things don't fall perfectly into one category or the other.
- That said, it is a helpful framework as long as we recognize the discrete vs. continuous dichotomy is not a perfect classification
TopHat Question 1
Discrete objects: (select all that apply)
- Are countable
- Do not have distinct boundaries
- Are infinitely divisible
- Have well defined boundaries
Discrete Objects
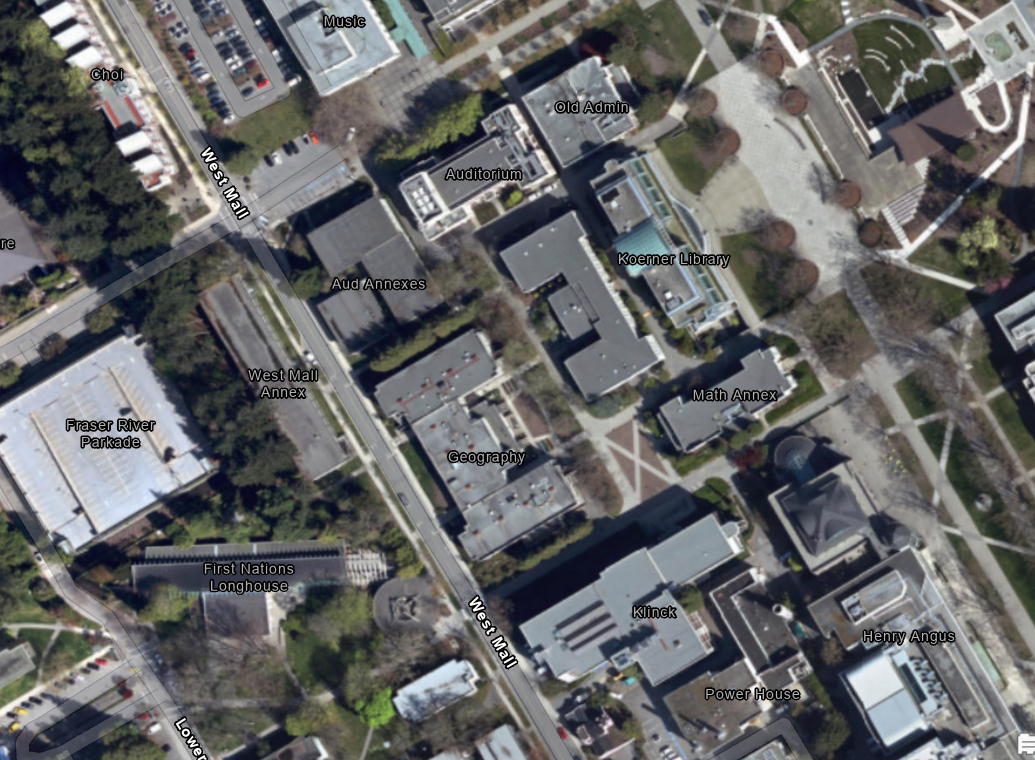
Buildings are a great example.
- Concrete boundaries
- Countable
- Real physical object
Discrete Objects
Political Boundaries are also a great example.
- Distinct boundaries
- Countable
- Not a physical object
Continuous Fields
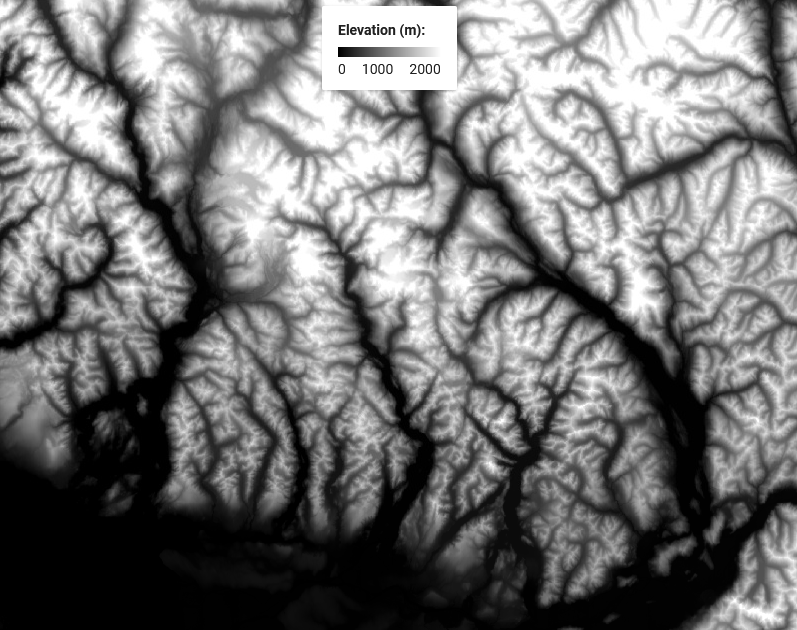
Elevation is a great example.
- Everywhere on Earth
- No "number of elevations"
- A physical property
Continuous Fields
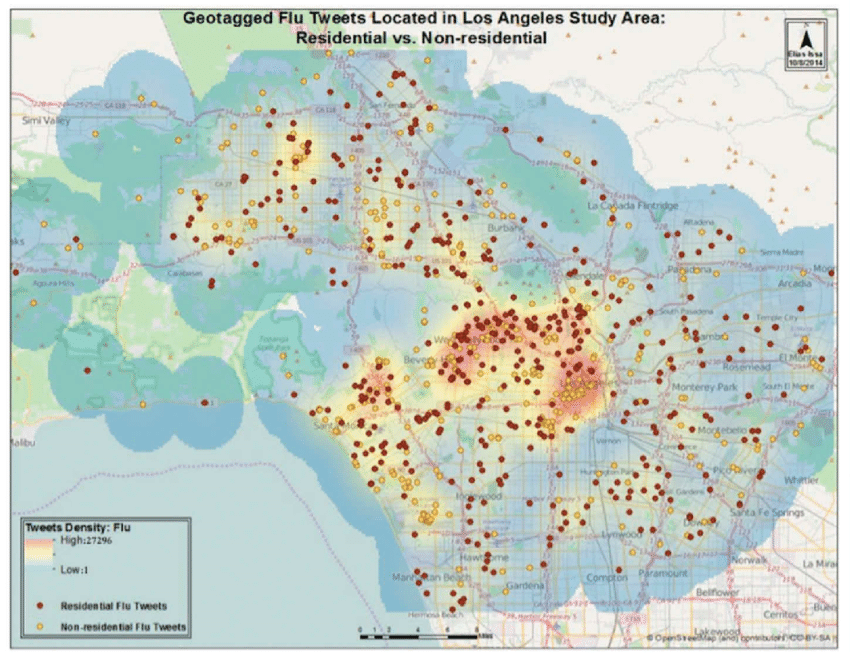
Density of tweets is also a great example.
- Everywhere has this too
- Derived from something countable
- But not countable itself
- Not a physical property
Working Together
Frequently we'll end up working with both discrete objects and continuous fields.
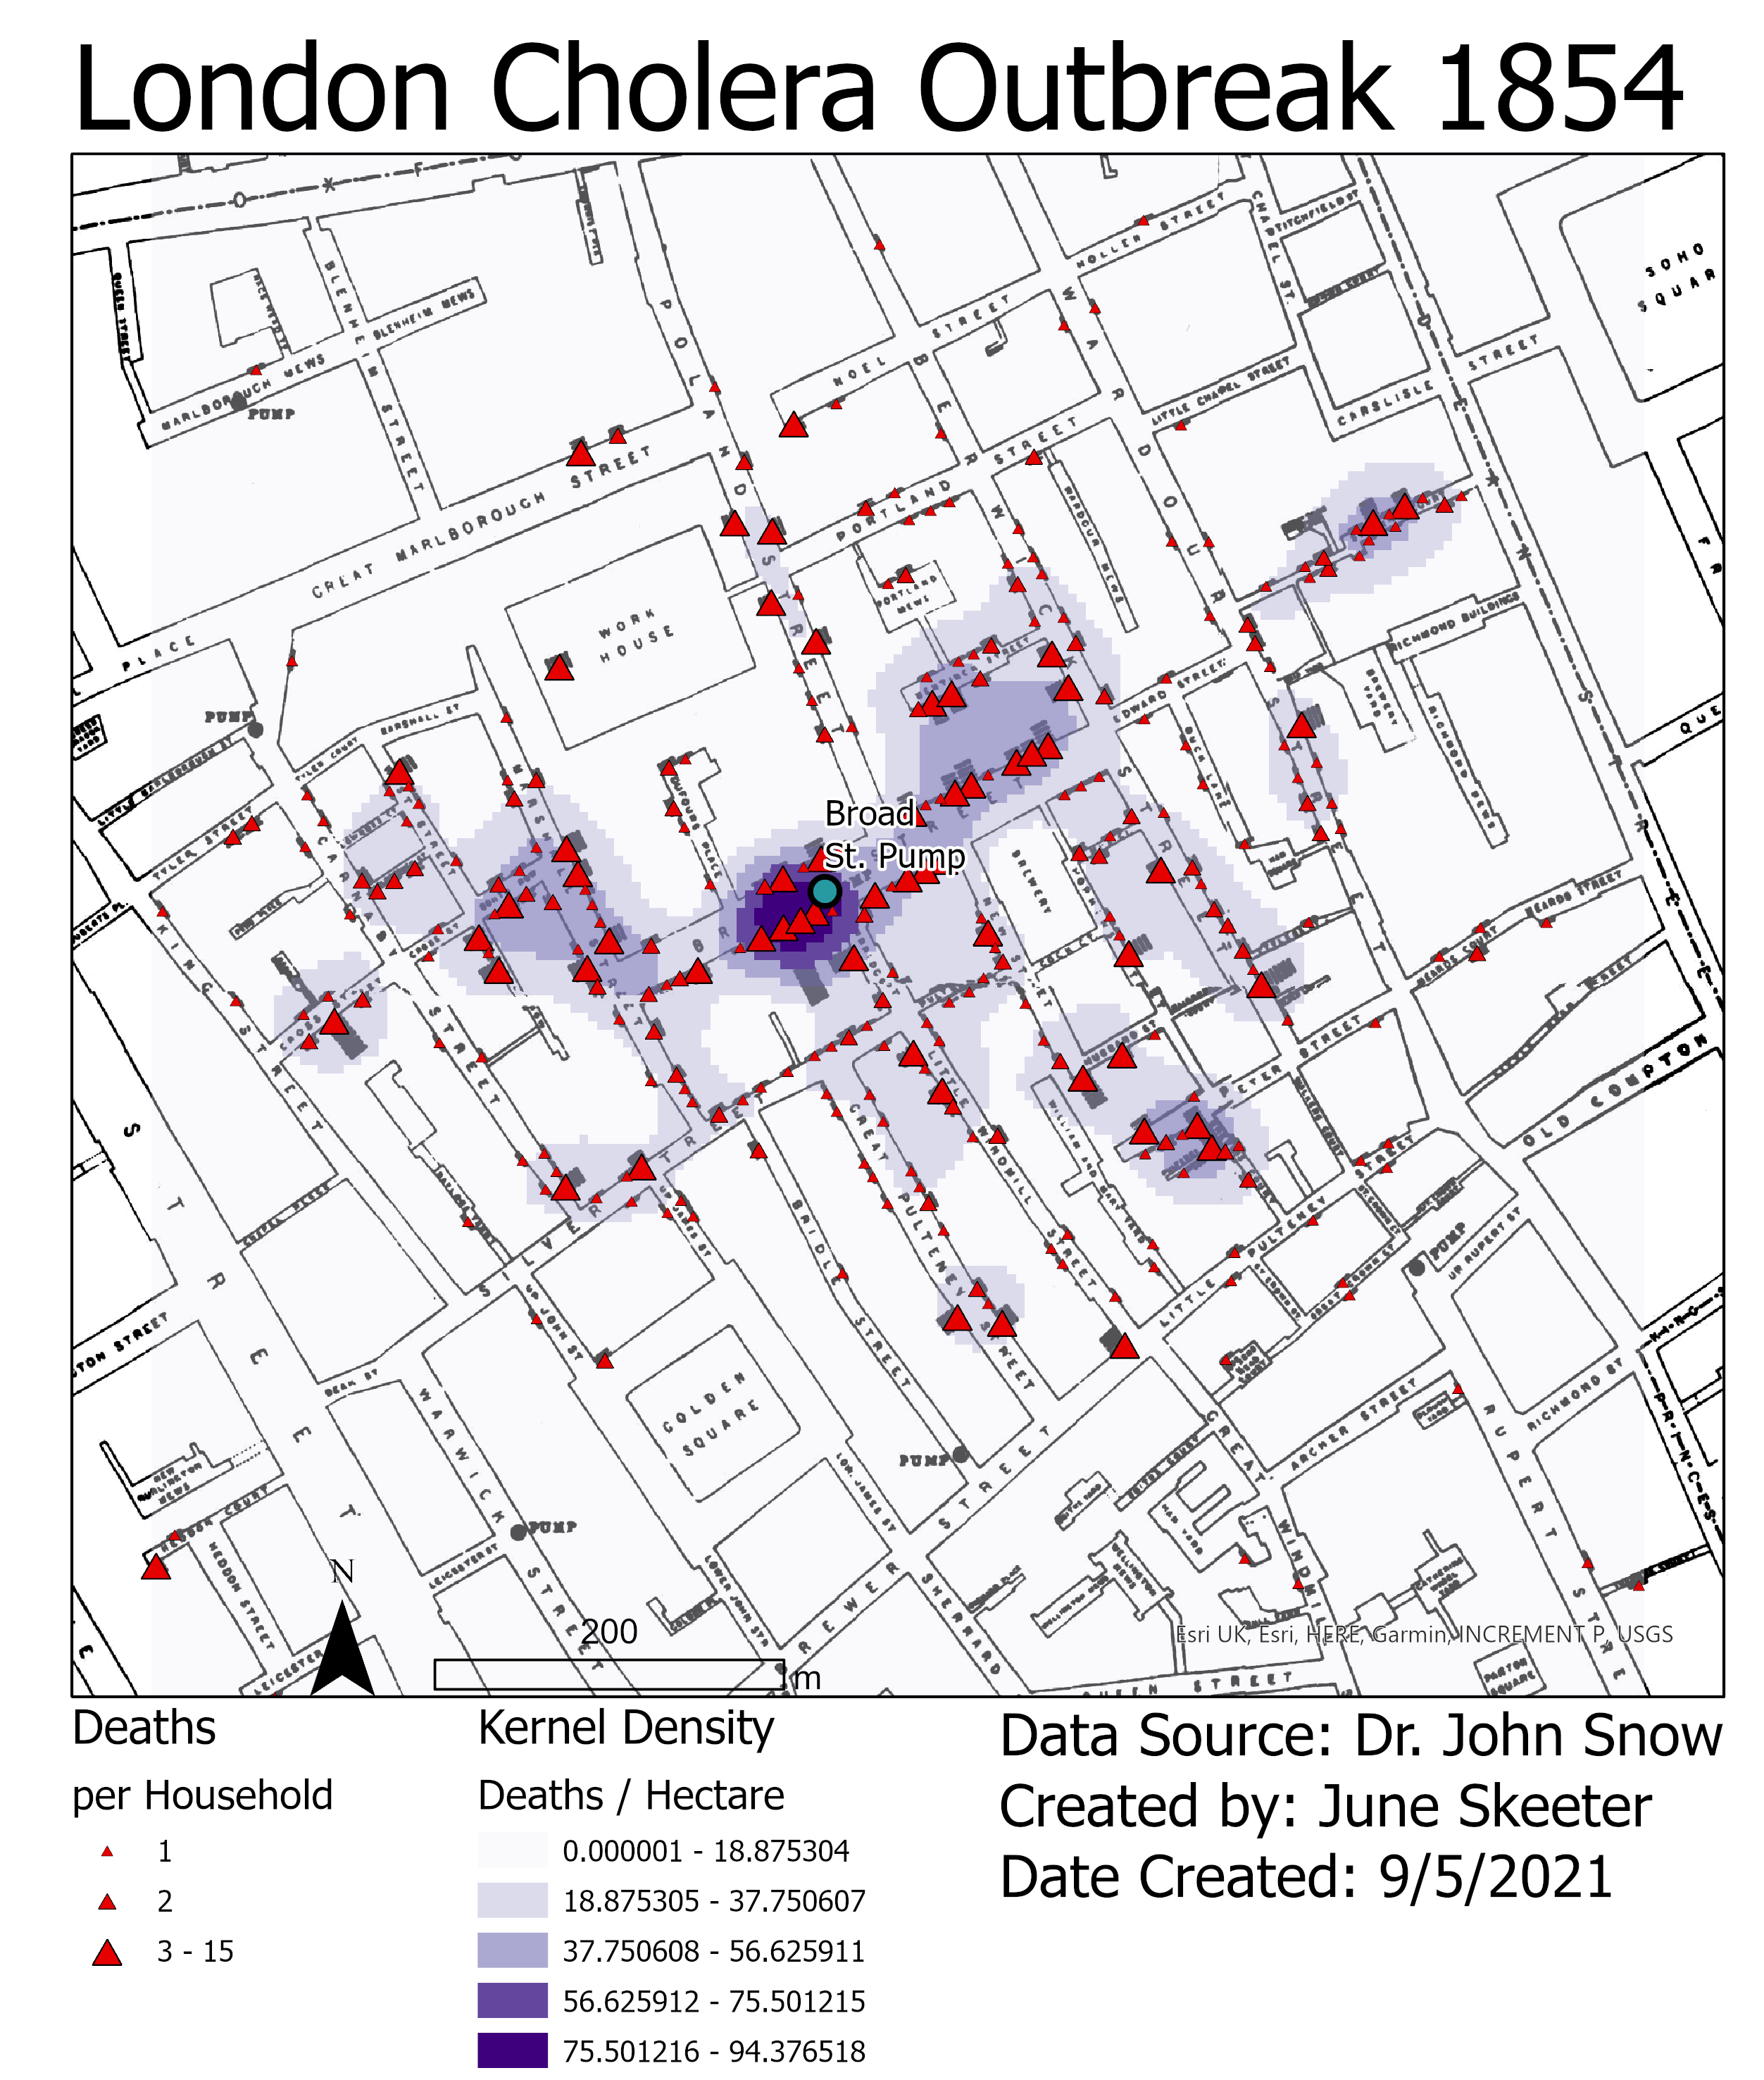
- In Module 1, you worked with:
- Cholera deaths (Discrete objects)
- Kernel density (continuous field)
- We use spatial data models to represent information in a GIS
- Vector Data Model = discrete objects
- Raster Data Model = continuous fields
Digital information
We'll talk more about spatial data models later. For now, lets think about data more broadly. How do we represent data in a computer?
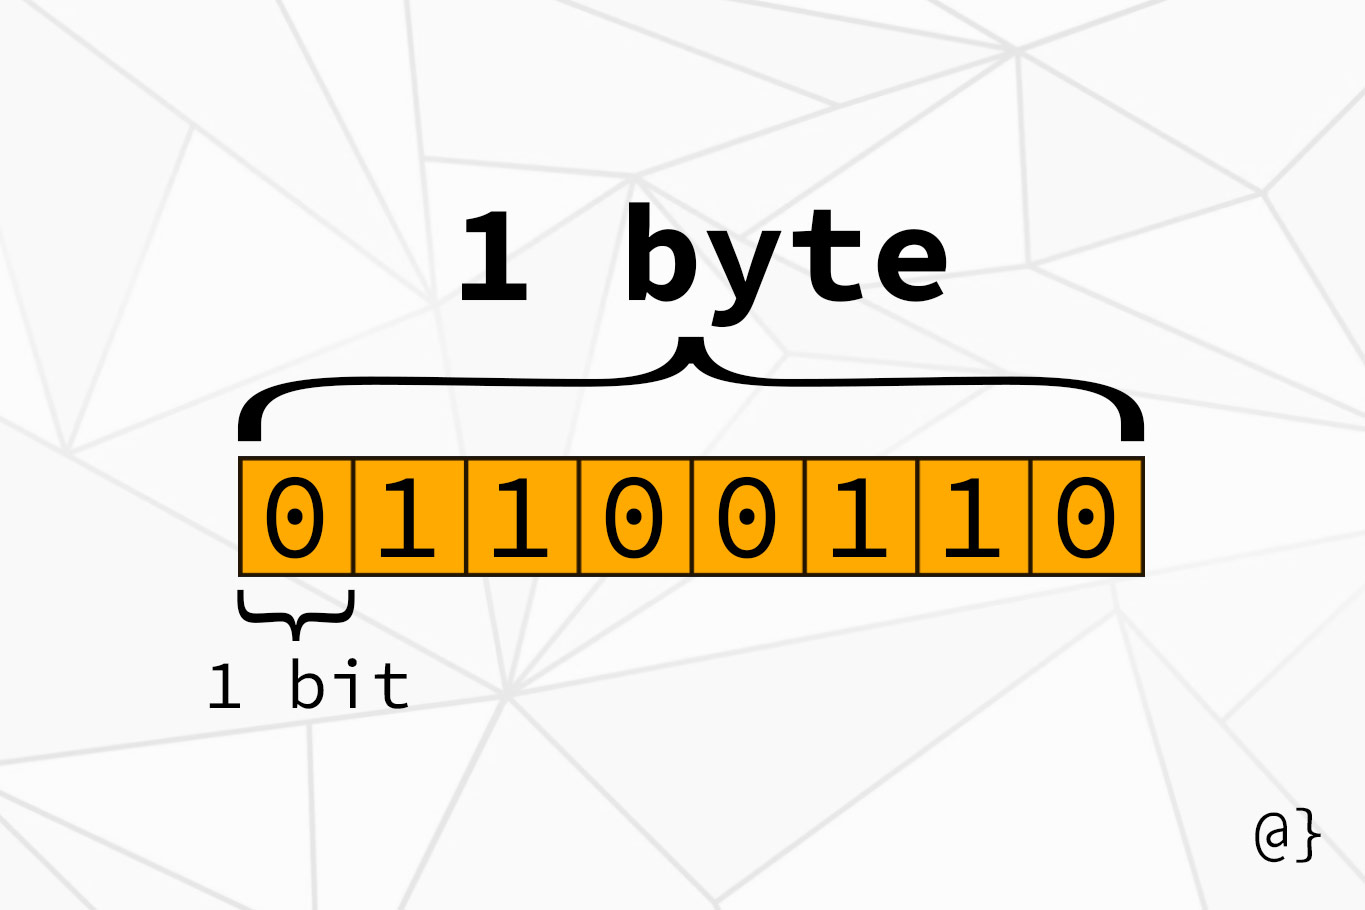
- Digital information is represented as bits (0's and 1's)
- We typically quantify data as bytes (8 bits):
- Kilobyte (kB) = 1,000 bytes
- Megabyte (MB) = 1,000,000 bytes
- Gigabyte (GB) = 1,000,000,000 bytes
Digital information
There are numerous ways to translate human readable data to binary, such as ASCII.
- Each character is represented as one byte
- There are 28 = 256 unique combinations of 0's and 1's in a byte
- Some examples:
- "A" : 01000001
- "CAT": 01000011 01000001 01010100
- "31": 00110011 00110001
Digital Information
Modern computers use 64-bit "architecture". That is, the central processing unit (CPU) can handle 64 bits (8 bytes) of information at a time.
- "Word" length is 64 bits
- A "Word" is a unit of data
- i.e., an individual piece of information
- 264 possible unique values
- >18 quintillion possible unique combinations of 1's and 0's to describe something
- CPUs can be stacked in parallel to handle more information at one time
Representing Phenomena in GIS
Within the context of a GIS, every piece of information describing a phenomenon is referred to as an Attribute.
- Broadly speaking each attribute can address one of three questions:
- Where?
- What?
- When?
Types of Attributes
There are multiple ways to classify/think about attributes. One important distinction we must make
- Non-Spatial Attributes: describe what or when
- Spatial Attributes: describe where
- Puts the Geographic in GIS
- Requires some special considerations
- We have already talked a bit about these consideration (map projections)
- We'll discuss more considerations in the next module
Types of Attributes
All data (attributes), spatial and non-spatial, can be either qualitative or quantitative.
- The types of analysis we can do with qualitative data are more limited
- That does not make quantitative data “better”
- Measurement scales: both qualitative and quantitative can be measured on different scales
- Qualitative: Nominal or Ordinal Sales
- Quantitative: Interval or Ratio Sales
Qualitative Data
Qualitative data is Categorical. It is strictly descriptive and lacks any meaningful numeric value.
- Textual, coded numerals, pictures, sounds, etc
- Typically working with textual & coded numerals most frequently in GIS
- Limited number of computational options, often requires careful consideration when analyzing
- Measured on either a Nominal or Ordinal scale.
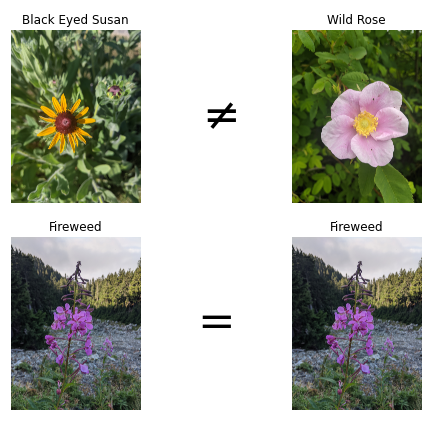
Nominal Scale
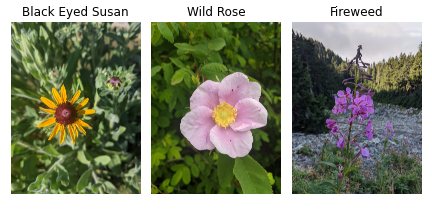
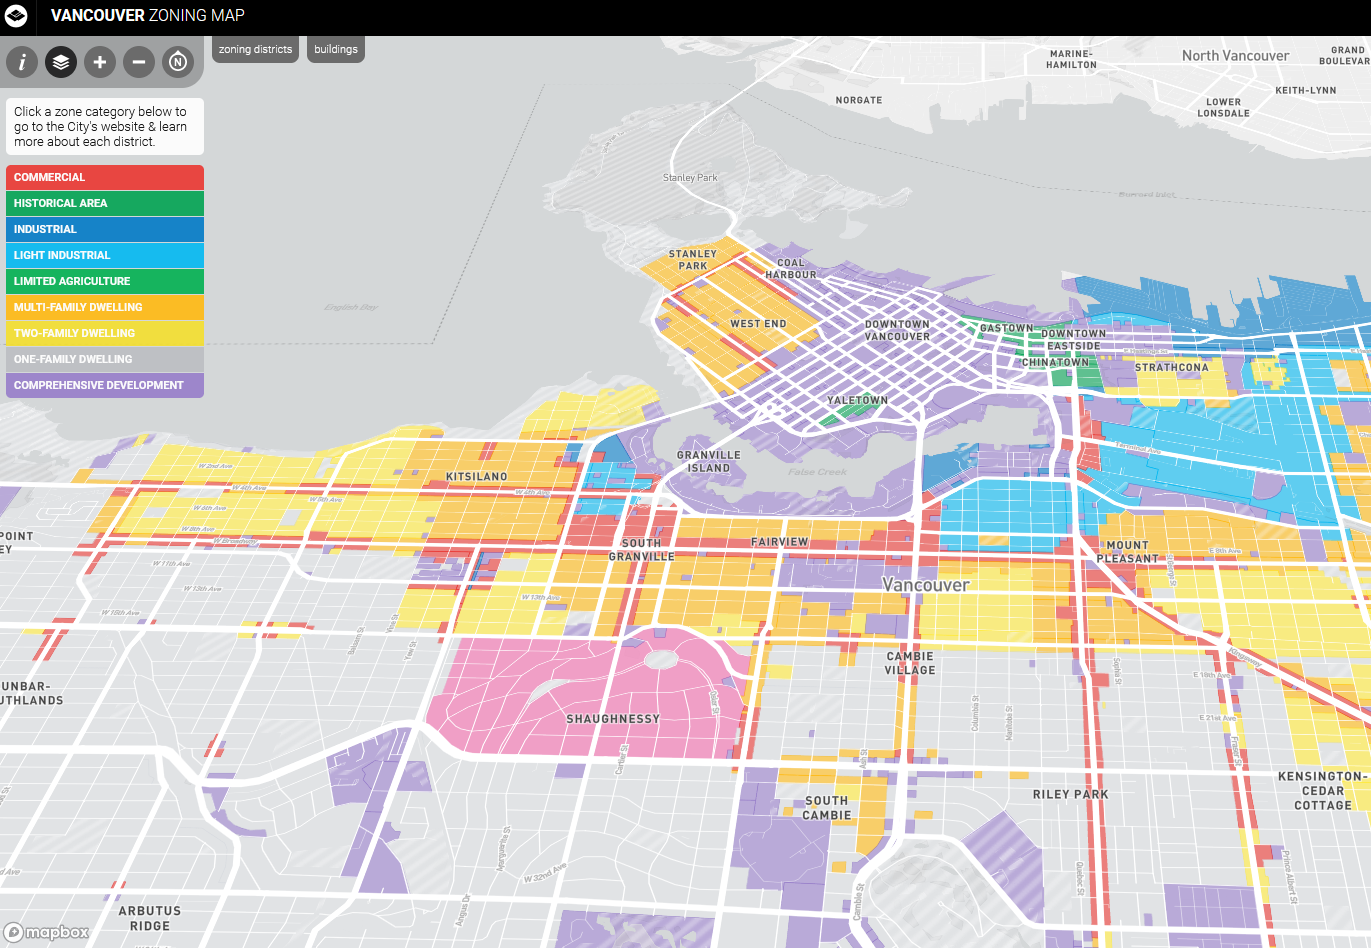
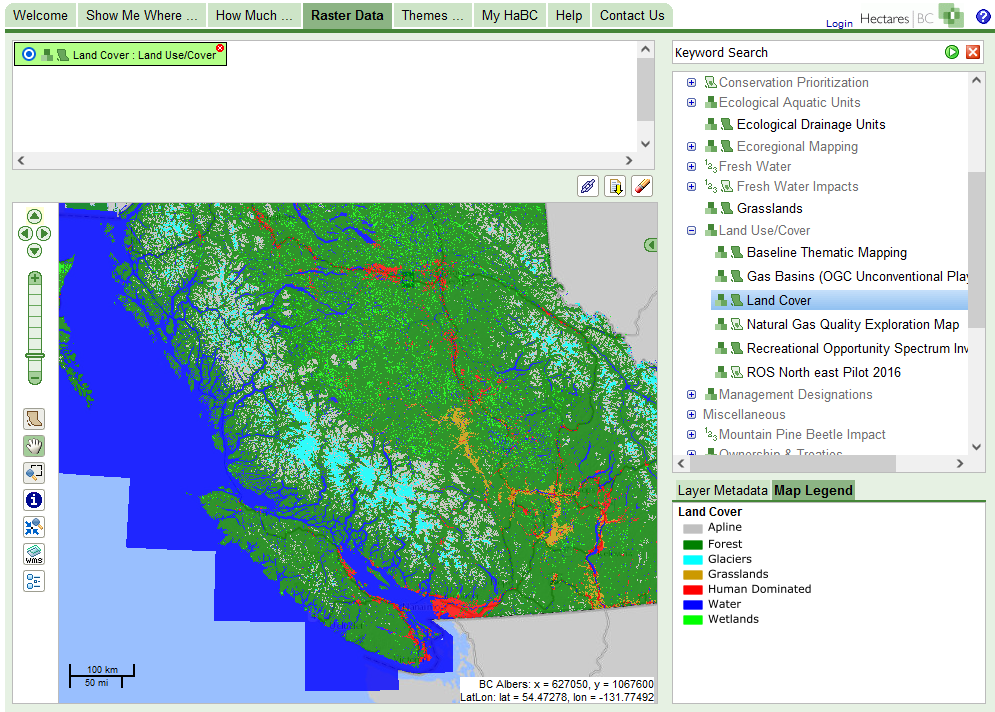
Names or categories with no ranking or direction. Categories are not more/less, better/worse, they just different. Some examples include:
- Flower Species
- Zoning Categories
- Land cover Classification
Nominal Operations
With nominal data we can:
- Check equivalency
- Count frequencies
- Nothing else
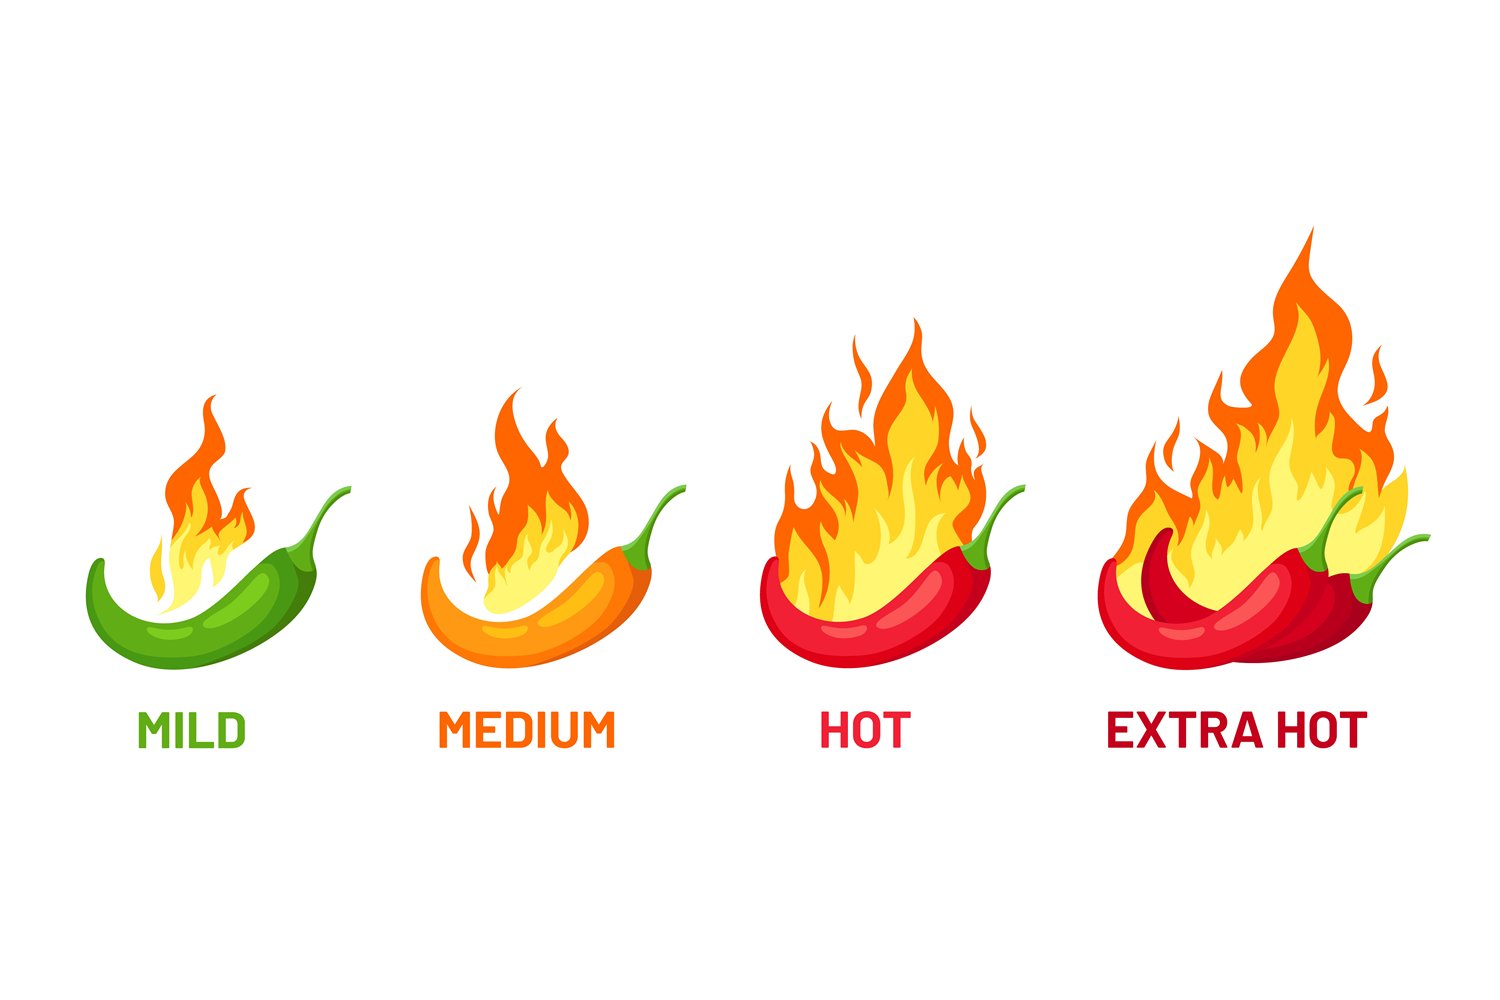
Ordinal Scale
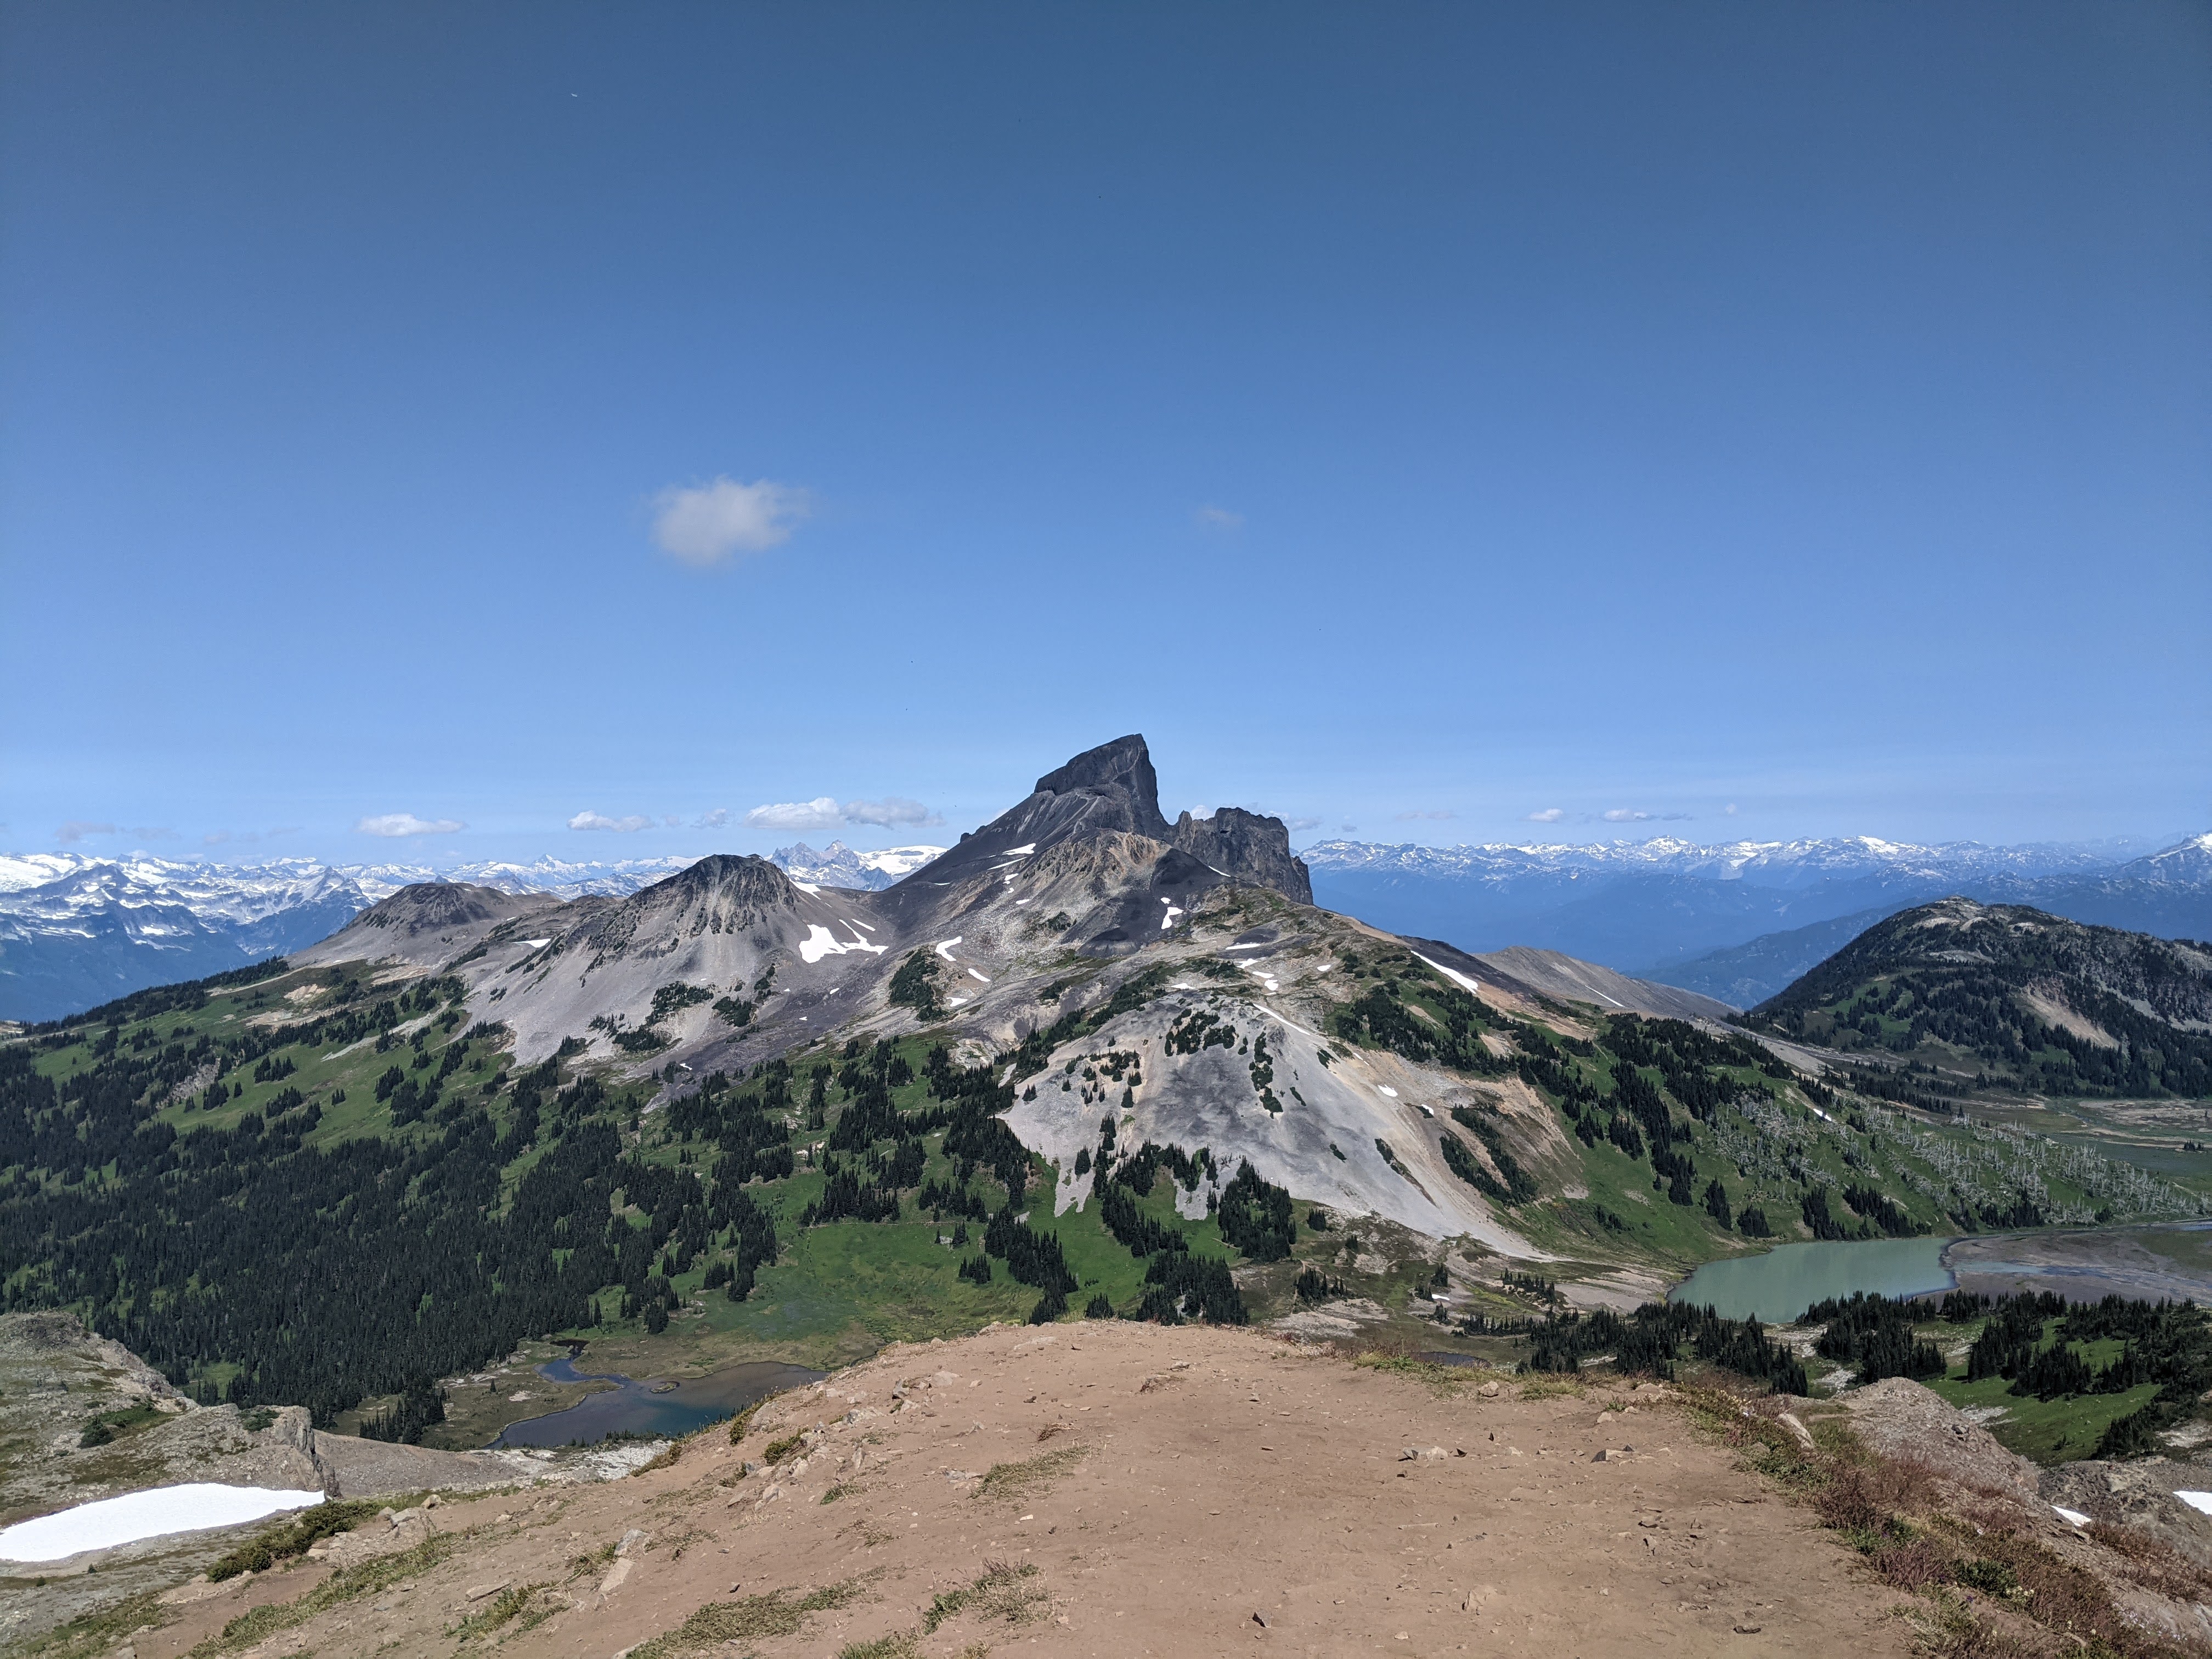
Names or categories with a ranking or direction. Categories are more/less, better/worse, etc. But the differences are relative, there is no way to say by "how much". Some examples include:
- Spice levels
- Relative heights
- Compass Direction


Ordinal Operations
With ordinal data we can:
- Check equivalency
- Count frequencies
- Check order/rank
All the same operations as nominal data + more.
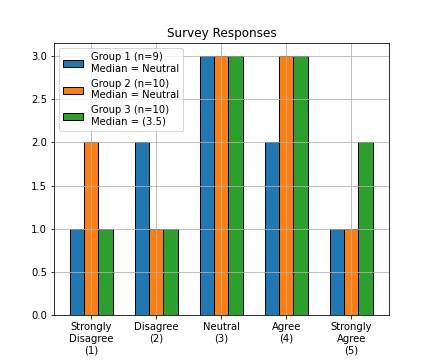
Ordinal Operations
Sometimes we can calculate the median.
- Odd sets the median is the middle.
- Even sets, average of the middle two.
- One solution, arbitrarily assign a numeric score.
All the same operations as nominal data + more.
Graded Membership
Exceptions that blur the lines.
- Grade membership to assign categories
- Where to draw the line between forest/alpine?
- Winner take all: alpine meadow
- 45% alpine meadow
- 40% forest
- 5% bare rock
Graded Membership
In practice, lots of qualitative data we work with, especially for natural phenomena, are actually graded membership.
- The downside: variability within the area is lost.
TopHat Question 2
Which of the following would be examples of Nominal Data? (select all that apply)
- Air temperature
- Ice cream flavors
- Tree height
- Colors
- Drink sizes
Quantitative Data
Quantitative data is Numeric. It describe the quantities associated with a phenomenon. Key properties include:
- Values separated by a meaningful unit.
- More arithmetic operations possible.
- Can be Discrete or Continuous numbers.
- Measured on either a Ratio or Interval scale.
Kinds of Numbers
Discrete
- Whole numbers
- Counts
- Not infinitely divisible
- Names in ArcGIS Pro:
- Integer, Long, etc.
Continuous
- Decimals
- Measurements
- Infinitely divisible
- Names in ArcGIS Pro:
- Float, Double, etc.
Kinds of Numbers
Discrete
- Countable
- Examples:
- Population
- Year
- "Age"
Continuous
- Non-countable
- Examples:
- Temperature
- Height
- Speed
Quantitative Data
Both Interval and Ratio data can consist of discrete or continuous numbers. These types of quantitative data are closely related, but have one important distinction.
- Interval scales have an arbitrarily zero point, which means:
- Can have negative values
- Cannot multiply/divide ...
- To compare the magnitude of one value to another
- Can still multiply/divide for other calculations, i.e. calculating an average
- Ratio scales have a fixed, absolute zero point, which means:
- Cannot have negative values
- Absolute zero point does not imply an end point, can still have infinitely many values
- Can multiply/divide
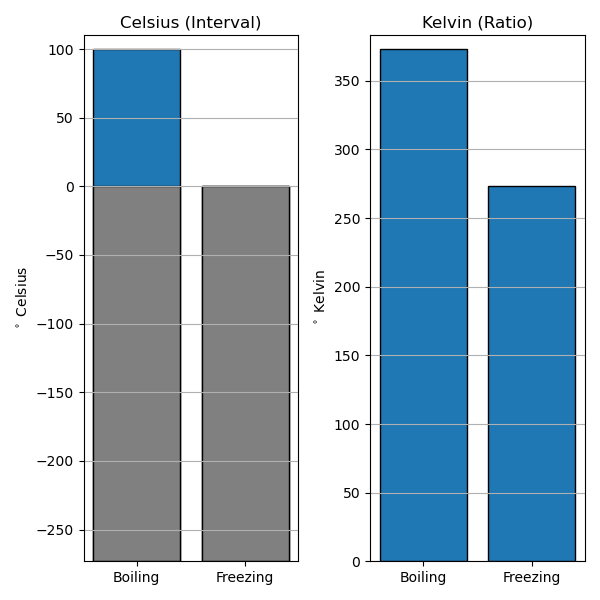
The Difference
Celsius (interval) vs. Kelvin (ratio).
- °C = K-273.15.
- 0 °C: Freezing point of water
- Drops below 0 °C all the time
- 0 K: "Absolute Zero"
- Physically cannot get any colder
- 100 °C is not ∞% warmer than as 0 °C
- It's actually ~ 36% warmer
- (373.15 K - 273.15 K) ⁄ 273.15 K ~ 0.36
Interval Scale
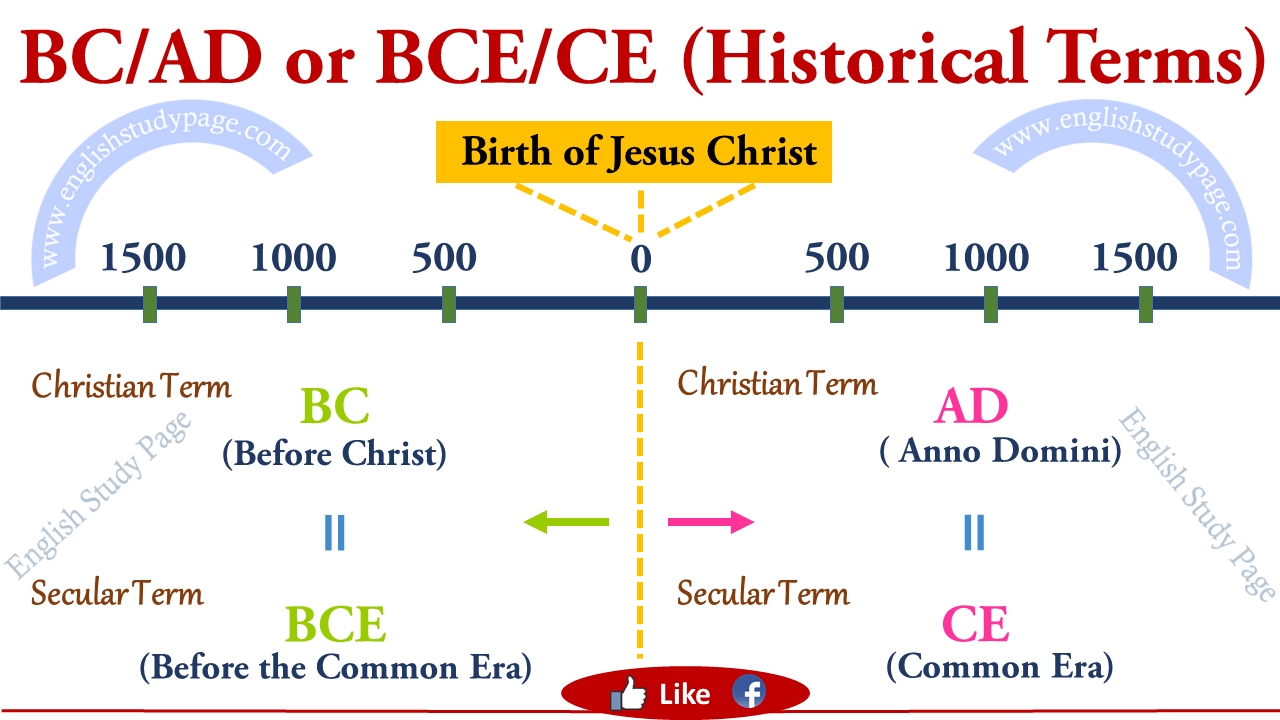
Interval data has an arbitrarily zero point. Examples include:
- Calendar years
- Discrete interval data
- Temperature (in celsius)
- Continuous interval data
- Other examples:
- ph scale (continuous)
- IQ scores (continuous)
- Times (discrete-ish)
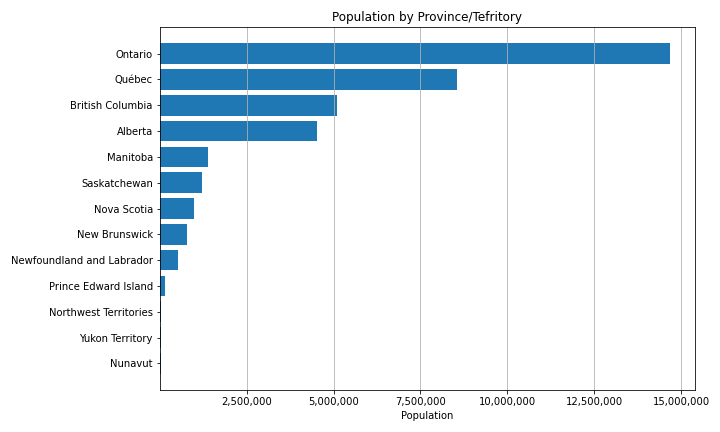
Ratio Scale
Ratio data has a fixed, absolute zero point. Examples include:
- Population
- Discrete ratio data
- Tree height
- Continuous ratio data
- Other examples:
- Precipitation (Continuous)
- Area (Continuous)
- Units of time (Continuous)
- Popular Vote Totals (Discrete)
TopHat Question 3
Match the value to the type measurement scale and type of number:
| Length a hiking trail | Interval (Discrete) |
| Temperature in Fahrenheit | Ratio (Discrete) |
| Global Orca Population | Ratio (Continuous) |
| Change in Global Orca Population from 2000 to 2022 | Interval (Continuous) |
Derived Ratio
Sometimes called normalizing or standardizing, we calculate derived ratios to account for the influence of a confounding variable over a variable of interest. e.x. Housing affordability (Ha):
- You need to account for income (I) to figure out how affordable rent (R) is:
- R: My rent $1,450/mo
- I: I make ~$4600/mo
- Ha: 31.5% of my income goes to rent
- Income and rent ($) are both discrete, housing affordability (%) is continuous.
-
$$ H_a = \frac{R}{I} $$
Derived Ratio
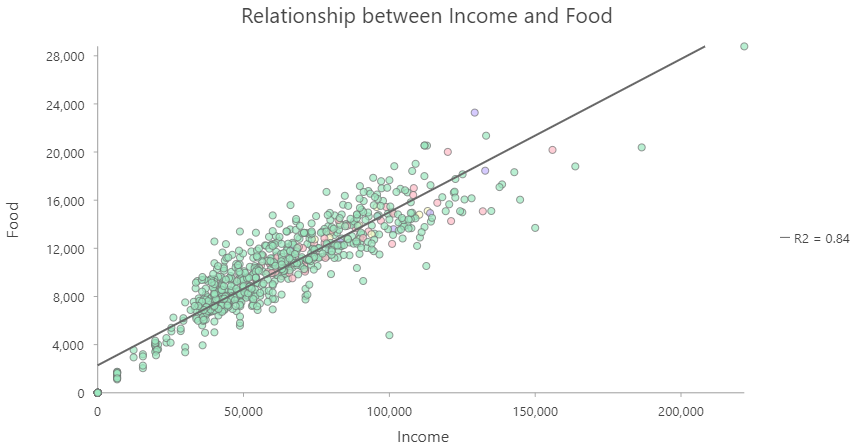
In Lab, you are going to work with two derived ratios:
- Income and Food expenditures are correlated
- Need to account for income if you analyze other factors
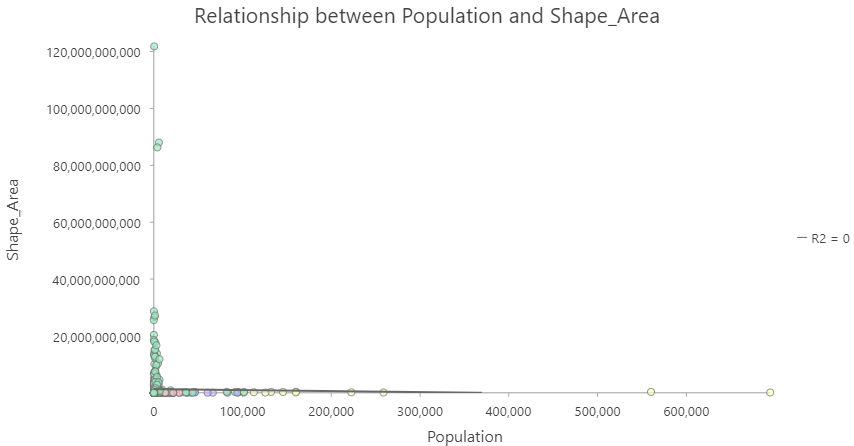
- Population and Area are not highly correlated
- But area definitely influences population
- Need to account for area to analyze other factors
TopHat Question 4
Speed is another example of a derived ratio. If a line of thunderstorm takes 5 hours to travel from Brandon, MB to Winnipeg, MB (200 km), what is the storm's speed in km/hr?
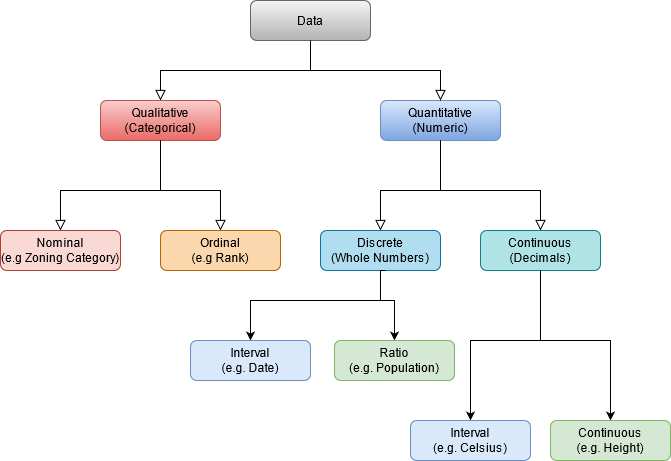
Summary: Types of Data
Summary: Operations by Data Type
| Operation | Nominal | Ordinal | Interval | Ratio |
| Equality | x | x | x | x |
| Counts/Mode | x | x | x | x |
| Rank/Order | x | x | x | |
| Median | ~ | x | x | |
| Add/Subtract | x | x | ||
| Mean | x | x | ||
| Multiply/Divide | x |