GIS Workflows
GIS Research Process
- Define your research question
- Identify the problems you will address and determine scale of your analysis
- Explore the available data
- Adjust your research question as needed
- Outline a plan for your analysis
- Conduct your analysis
- Clean, convert, reproject, and reclassify input data
- Spatial overlays, statistical tests, summary statistics, etc.
- Refine and incorporate more data as needed
- Share your results
- Visualizations, reports, publications, press releases, etc.
- Identify new questions
- Good research often generates more questions than it answers
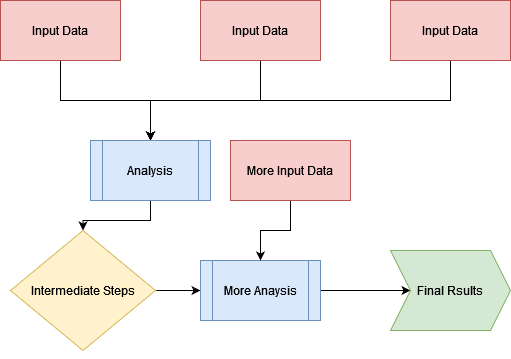
Visualizing a Workflow
It is a good idea to think through a workflow before conducting it.
- A flowchart is a diagram that outlines the key steps in an analysis
- A flowchart can help you
- Identify necessary analysis steps
- Think through the logical progression of analysis steps
- Catch errors before you start working
- Share your planned analysis with colleagues, funding organizations, etc.
TopHat Question 1
A _______ is a diagram that outlines the key steps in an analysis.
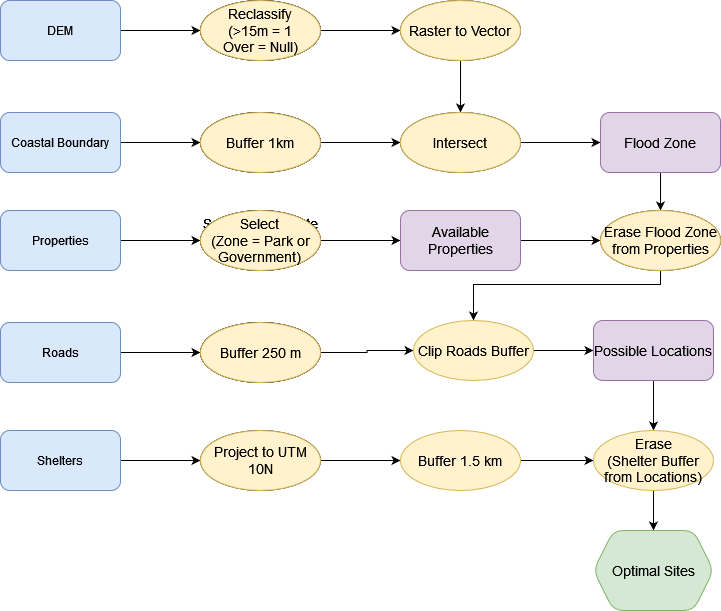
An Applied Example
Port Alberni has needs a new tsunami evacuation shelter and you have been tasked with finding a suitable location. The shelter must:
- Outside the flood zone:
- > 15 MASL or > 1 km from coast.
- > 1.5 km from existing shelters.
- < 250 m from an Arterial Roadway.
- Not on Residential, Commercial, or Industrial parcels.
Visualizing a Workflow
It is best to create a workflow that is repeatable, modifiable, and sharable.
- "Point and Click" GIS is not repeatable
- This can create issues when you:
- Need to write up a report
- Want to share how you completed a task
- Have to redo or update complex analyses
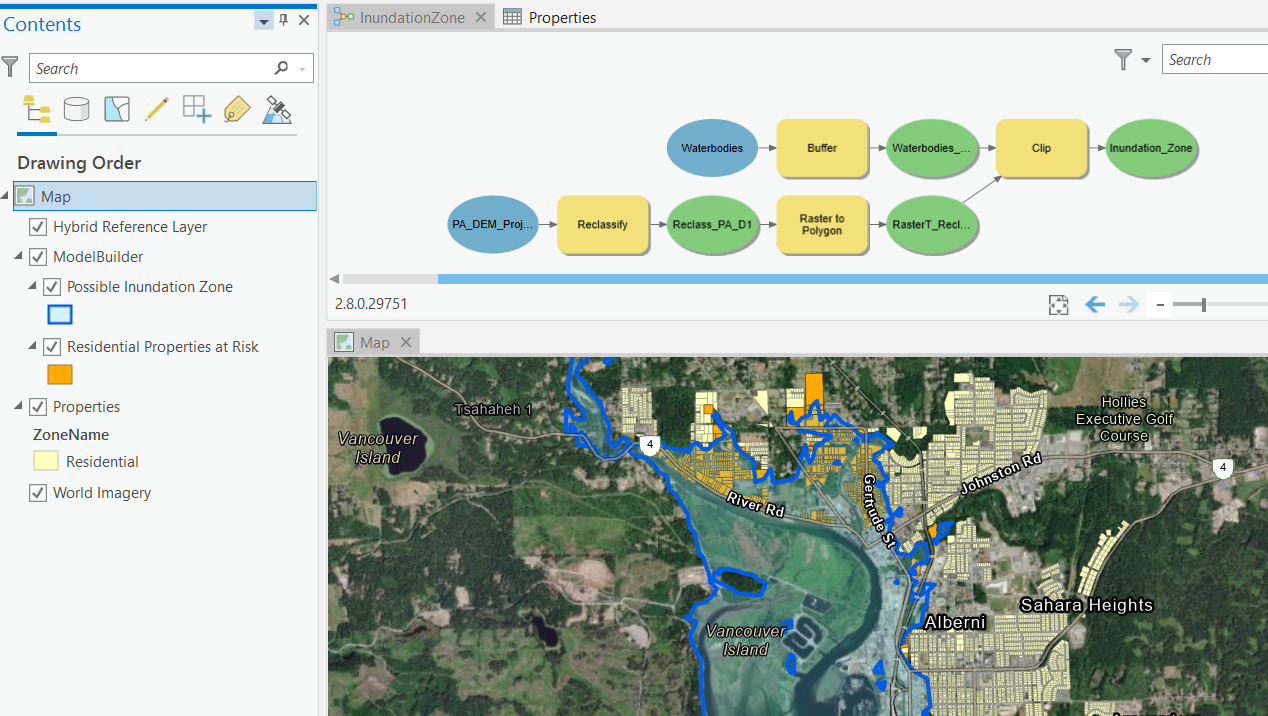
Visualizing a Workflow
Model Builder is a good solution for beginners.
- It lets you define you analysis steps using a flowchart
- Inputs are run trough the geoprocessing steps
- Models are easy to save and update
- Can be exported as custom tools
- Helps you visualize your results and share them with others
TopHat Question 2
This is useful tool in ArcGIS Pro that lets you define your analysis steps using a flowchart and create repeatable workflows.
- Model Builder
- Geoprocessing
- Raster Calculator
- Google Earth Engine
- Python
Visualizing a Workflow
If you pursue a GIS career, or any other science, you should consider learning to code.
- Code is replicable, legible, and even more explicit than a model
- Python is a great option for geospatial analysis
- Javascript is great for making web based applications and interactive visualizations
- R is useful for statistical analysis
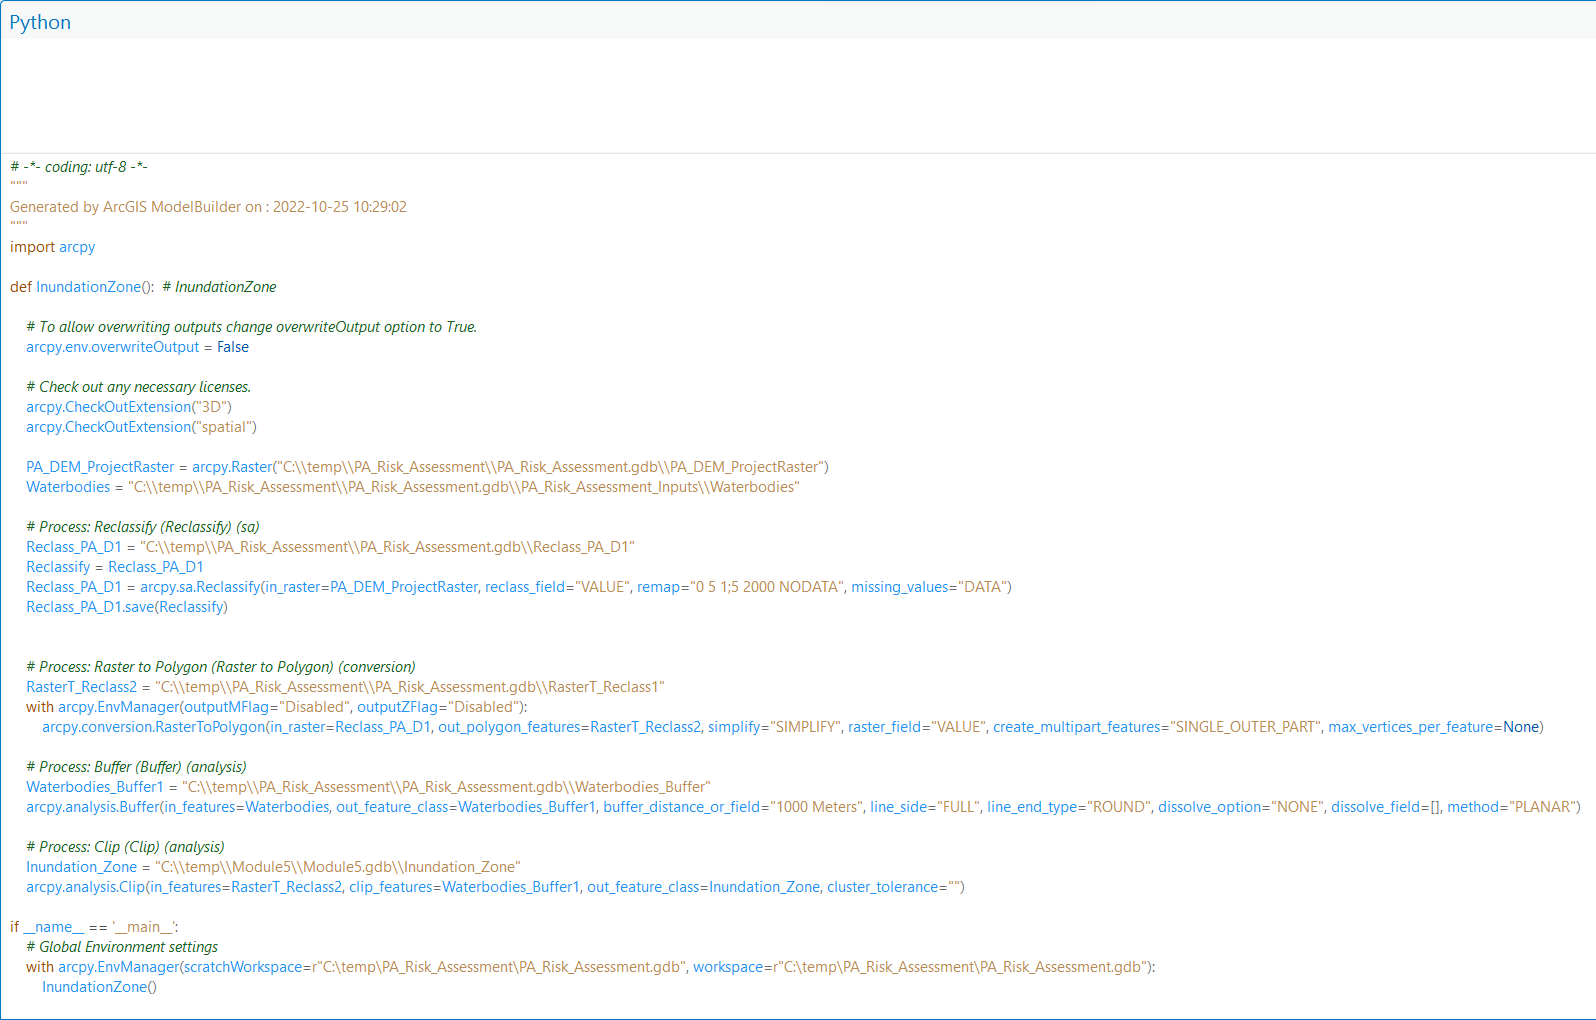
Models can be exported as Python code!
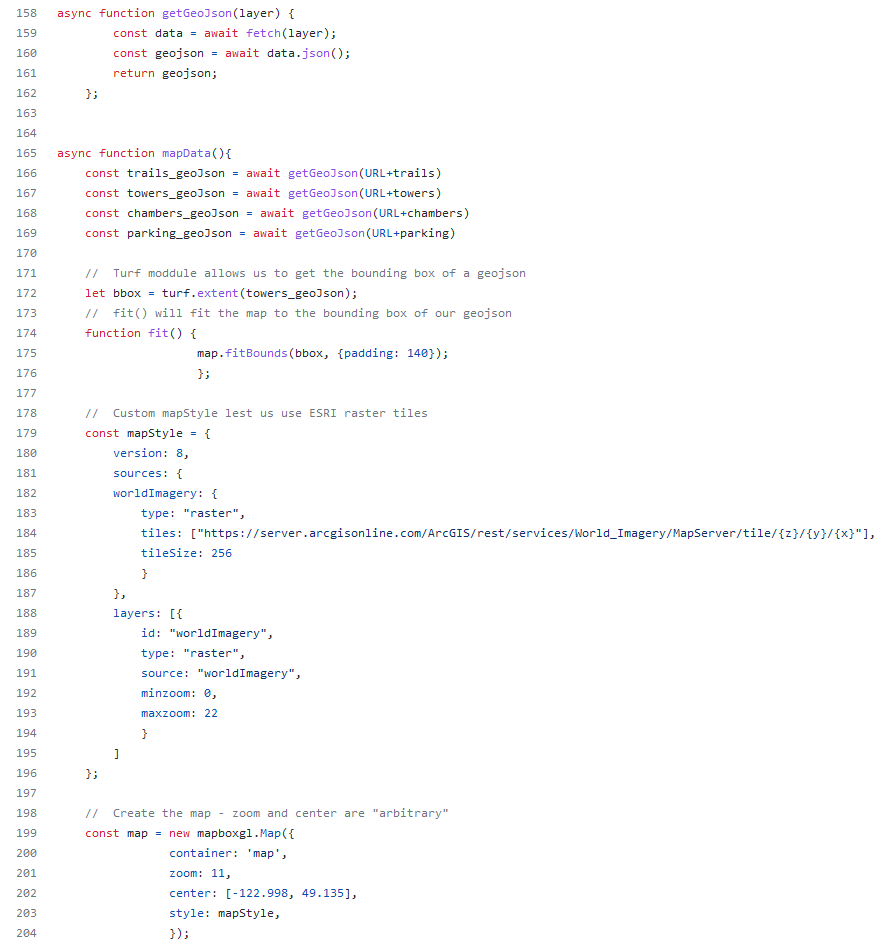
Javascript can create interactive web maps!
Javascript can create interactive web maps!
TopHat Question 3
These are programming languages that can be used to for GIS:
- Python
- Microsoft Excel
- Javascript
- ArcGIS Pro
- R