Raster Analysis Methods
Clip
Often our data is more "complex" than we need it to be. It is useful to parse, reclassify, and/or aggregate our data.
- Clip Raster: cuts raster down to a bounding box.
- Max N/S & E/W extent of another layer (vector or raster) or manually defined.
- Different tool than vector clipping
Raster clipping is similar to vector clipping
Reclassify
Often our data is more "complex" than we need it to be. It is useful to parse, reclassify, and/or aggregate our data.
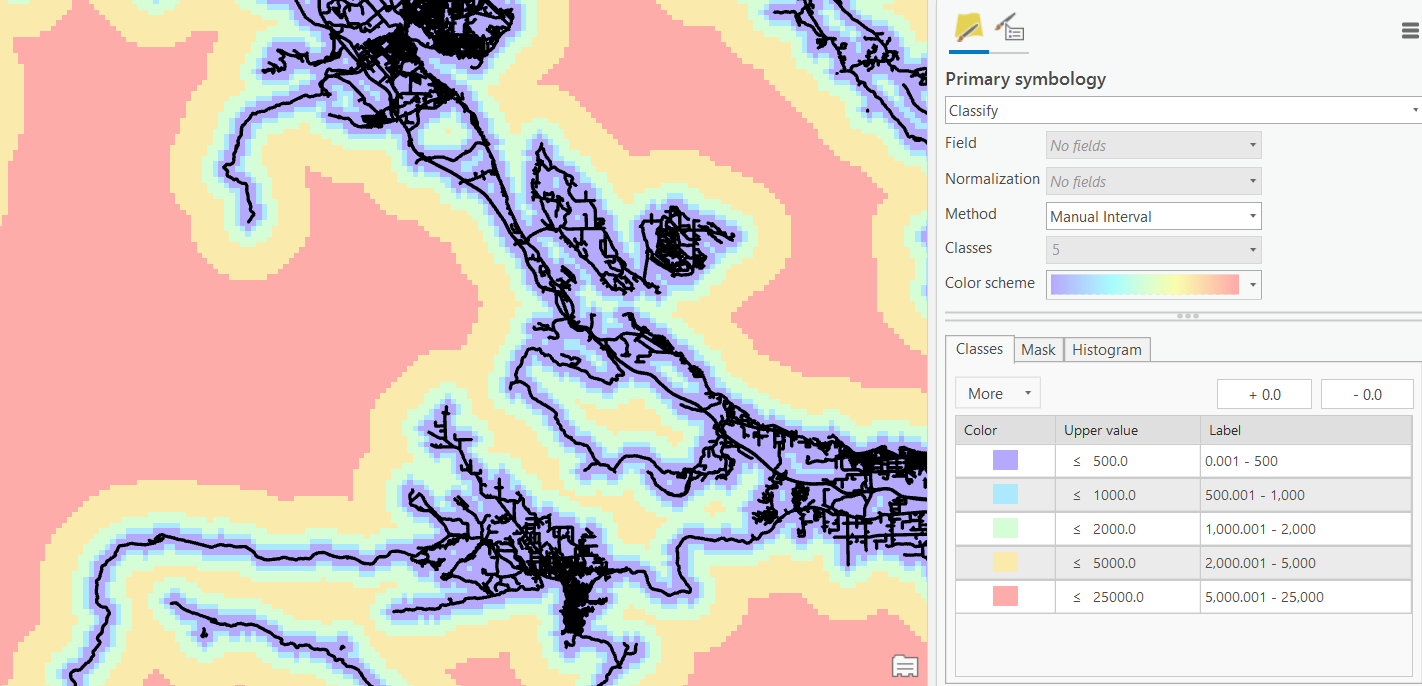
- Reclassify: creates a new output based on a classification scheme.
Reassign values or simplify data to reduce data volume
Reclassify
Often our data is more "complex" than we need it to be. It is useful to parse, reclassify, and/or aggregate our data.
- Reclassify: creates a new output based on a classification scheme.
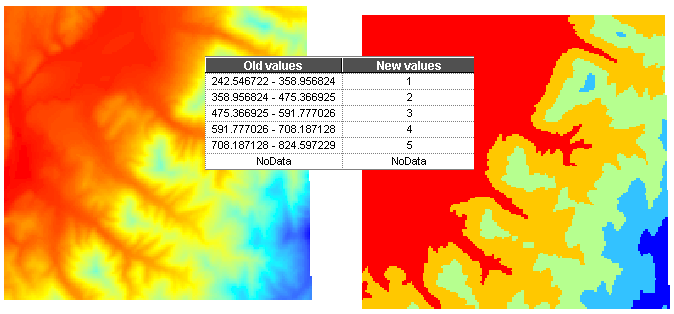
Reassign values or simplify data to reduce data volume
Mosaic
Often our data is more "complex" than we need it to be. It is useful to parse, reclassify, and/or aggregate our data.
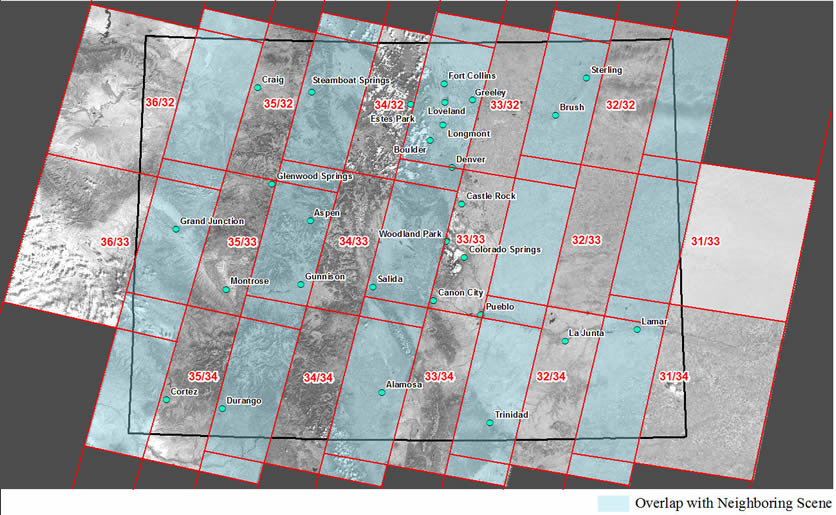
- Mosaic: Combine multiple raster data sets into one.
- There are multiple approaches we can use.
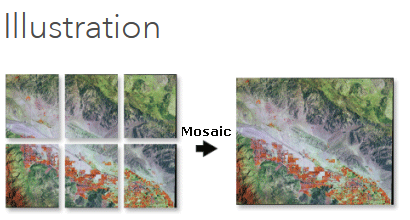
Often used to merge multiple satellite images
Mosaic
Often our data is more "complex" than we need it to be. It is useful to parse, reclassify, and/or aggregate our data.
- Mosaic: Combine multiple raster data sets into one.
- There are multiple approaches we can use.
Often used to merge multiple satellite images
Proximity Analysis
- Euclidean Distance: use this tool to calculate distance from the nearest feature or raster layer.
Raster Overlay
When we have multiple raster layers and we want to combine them to form a new output.
- Easy, efficient overlay is a key advantage of the raster data model
- We have a few tools we can use for this
Weighted Overlay
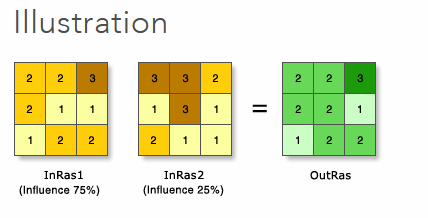
Weights inputs for suitability analysis or risk assessment.
- Inputs must be discrete numbers
- Manually define weights and scale
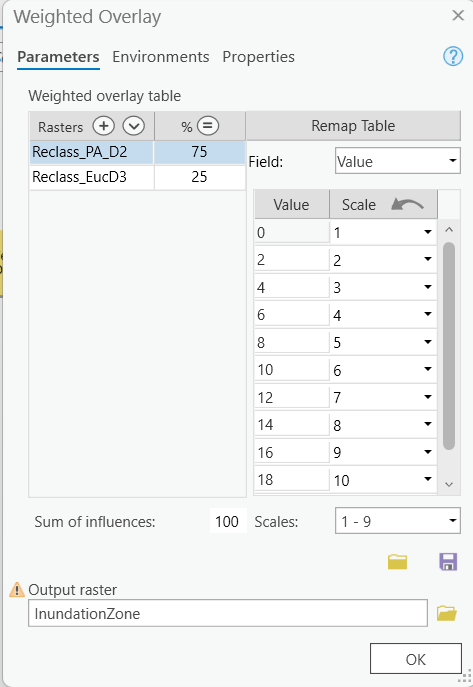
Weighted Overlay
Weights inputs for suitability analysis or risk assessment.
- Inputs must be discrete numbers
- Manually define weights and scale
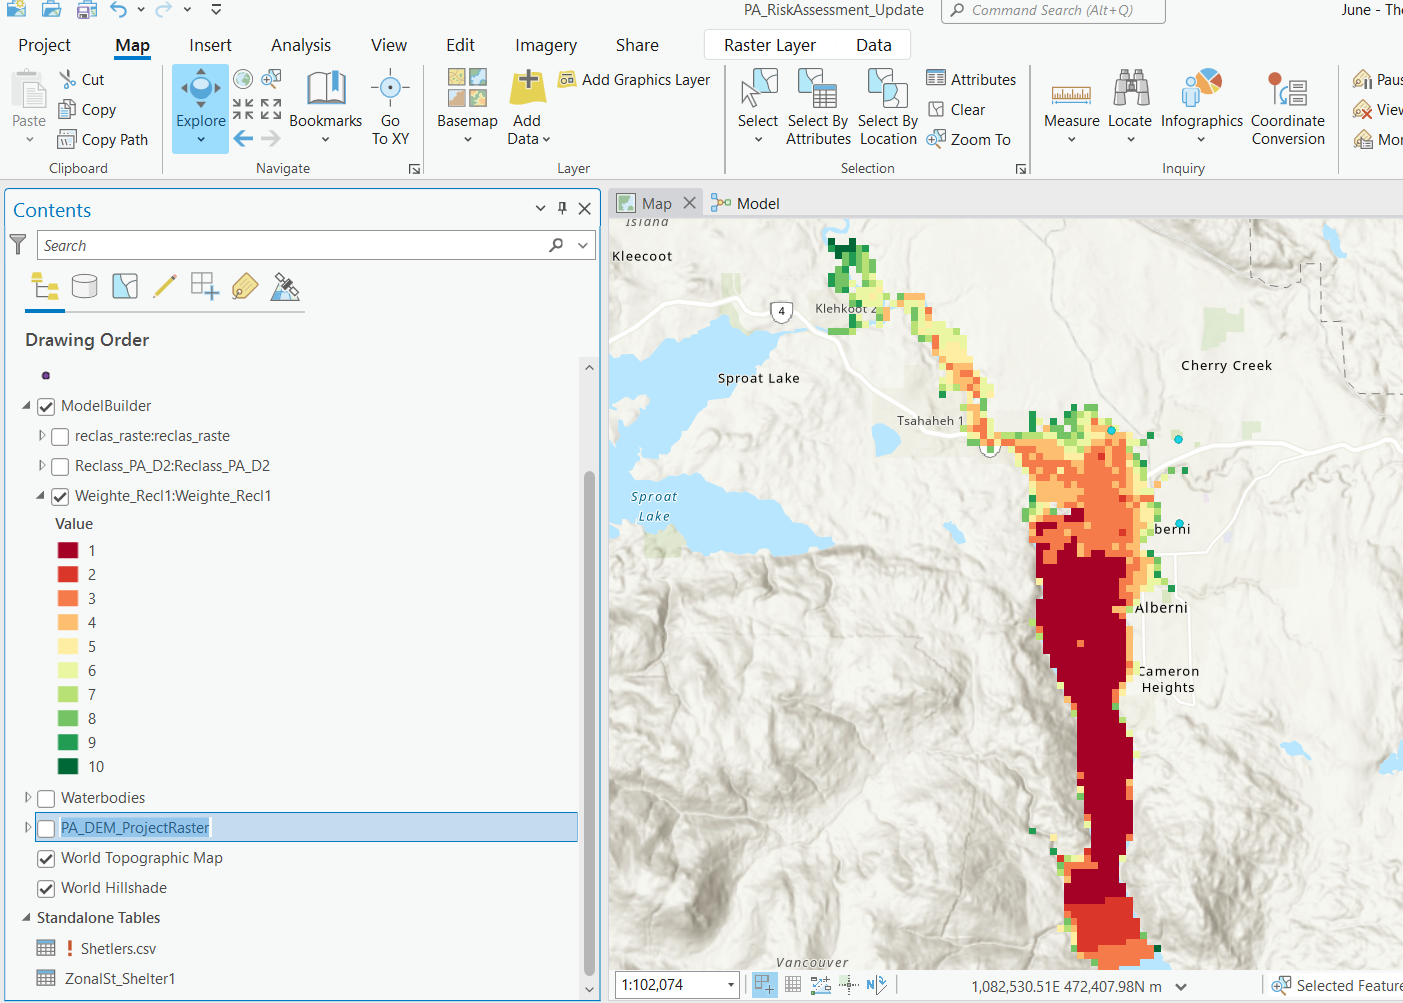
Outputs discrete classification.
Raster Calculator
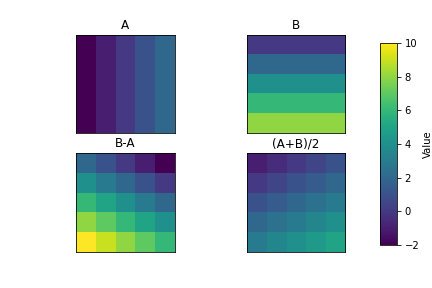
More general and flexible than weighted overlay.
- Outputs are more straightforward
- Because inputs are more explicit
- Can do weighted overlay among other tasks
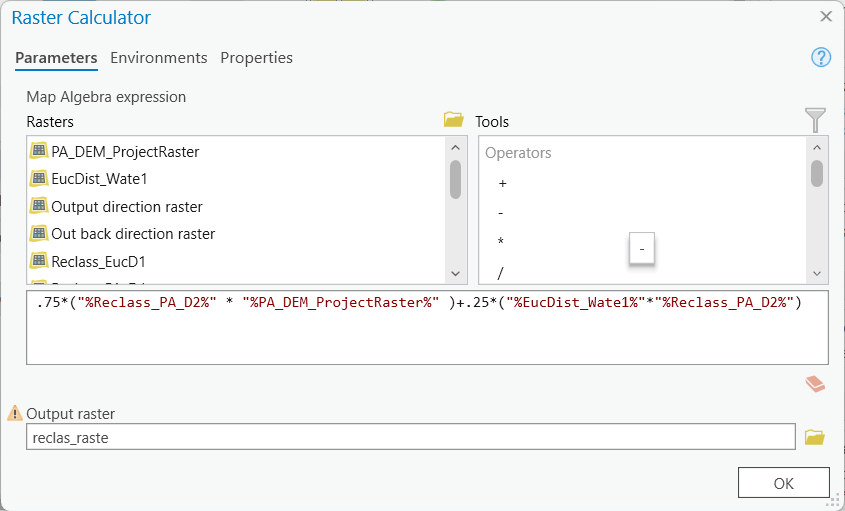
Raster Calculator
More general and flexible than weighted overlay.
- Outputs are more straightforward
- Because inputs are more explicit
- Can do weighted overlay among other tasks
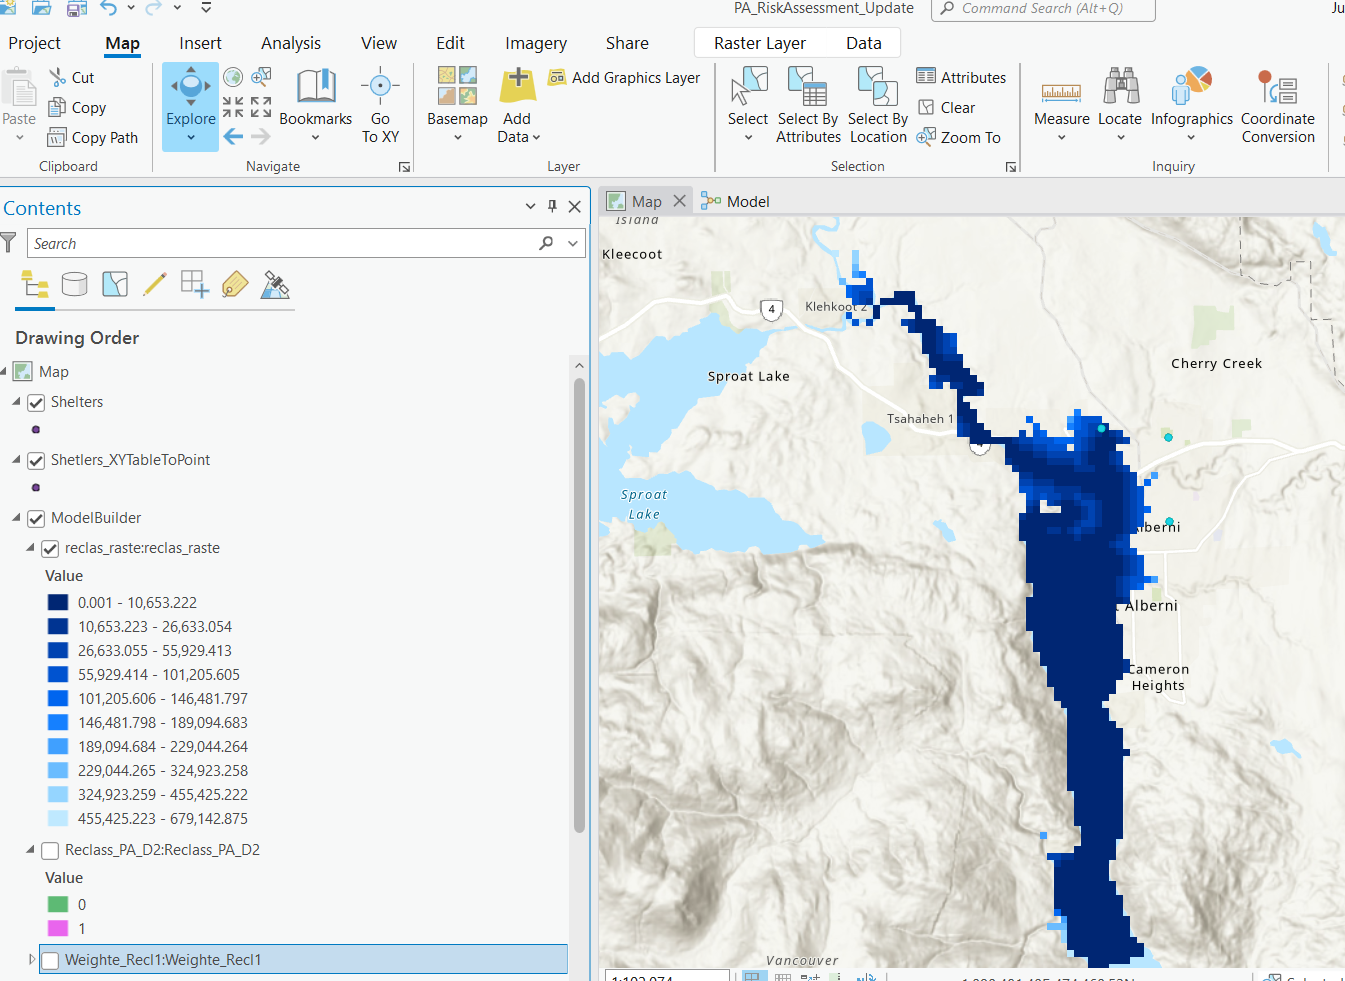
Outputs continuous gradient.
TopHat Question 1
This tool allows you to define equations using raster layers as variables.
- Weighted Overlay
- Raster Calculator
- Reclassify
- Mosaic
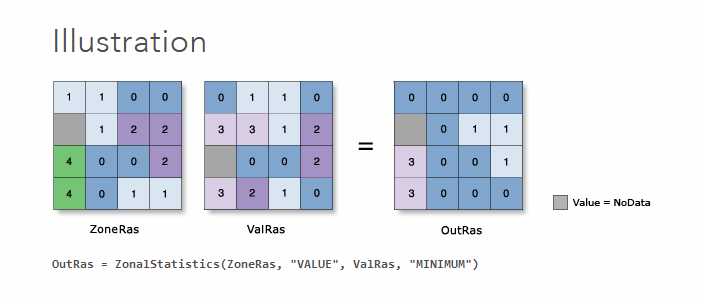
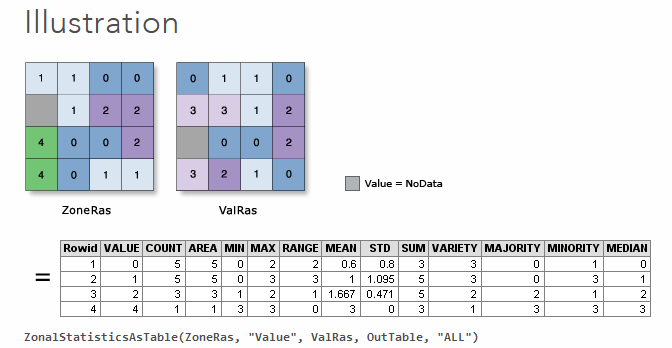
Zonal Statistics
Calculate statistics (mean, max, etc.) using zones (regions) and output desired statistic by zone.
- The zone can be either a raster or vector layer.
- Zonal Statistics as Table generates a table containing multiple statistics by zone.
Surface Analysis
These tools are specifically designed to analyze terrain surfaces (ie. Digital Elevation Models).
- However, they can be applied to other purposes in select applications
- Slope: calculates the slope of a terrain surface
- ie. the angle in degrees from a cell to it's "lowest" neighbor
Surface Analysis
These tools are specifically designed to analyze terrain surfaces (ie. Digital Elevation Models).
- However, they can be applied to other purposes in select applications
- Aspect: calculates the direction a slope is facing
- North, southeast, west northwest, etc.
TopHat Question 2
The euclidean-distance tool lets you calculate the slope and aspect of a raster layer.
- True
- False
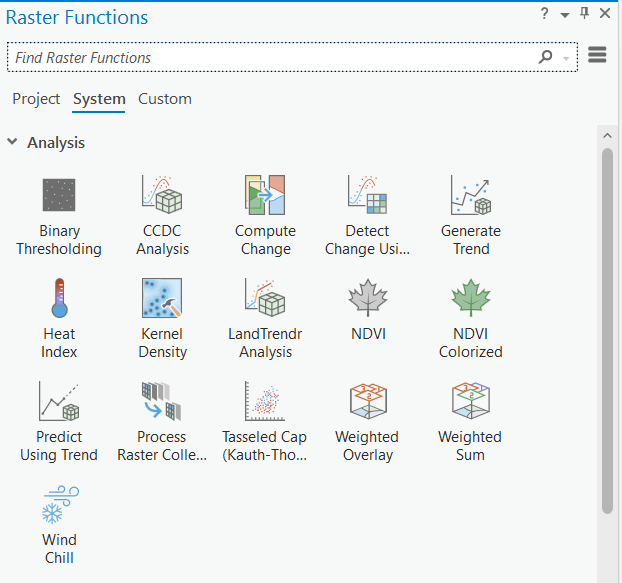
Raster Functions
ArcGIS Pro has an extensive toolkit of tools for more complex analyses.
- Many are beyond the scope of intro-level GIS
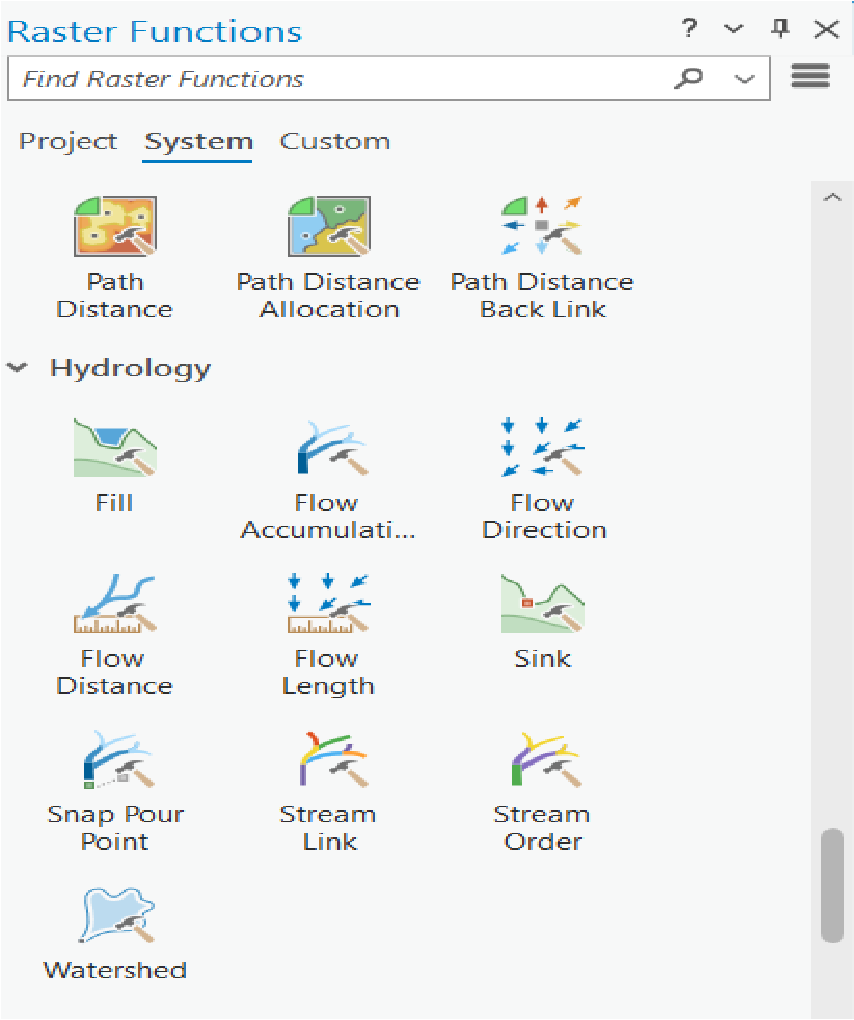
Hydrologic Modelling
The Hydrology toolset can be used to calculate stream flow.
- Use a DEM as an input
- Fill "sinks"
- Calculate flow direction
- Run flow accumulation
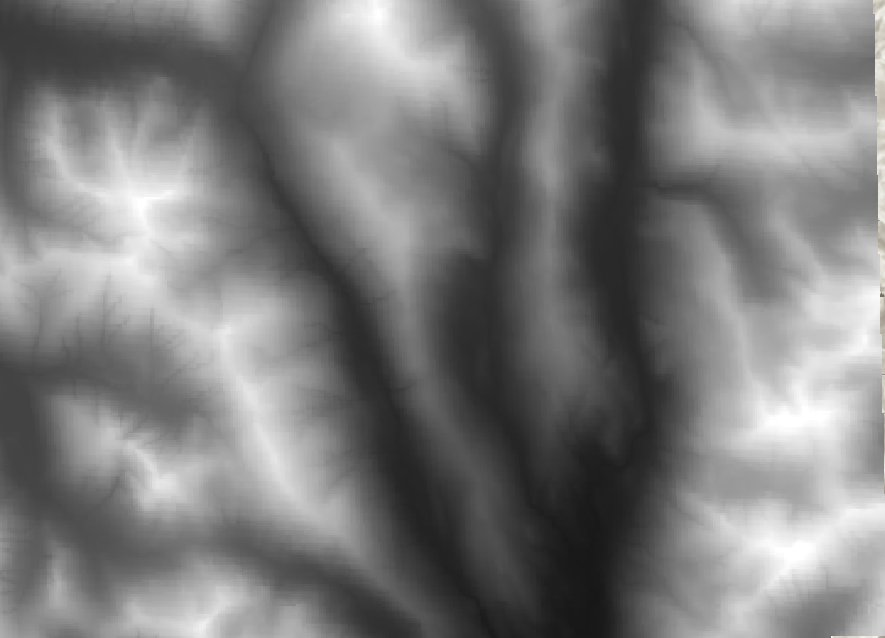
DEM Input
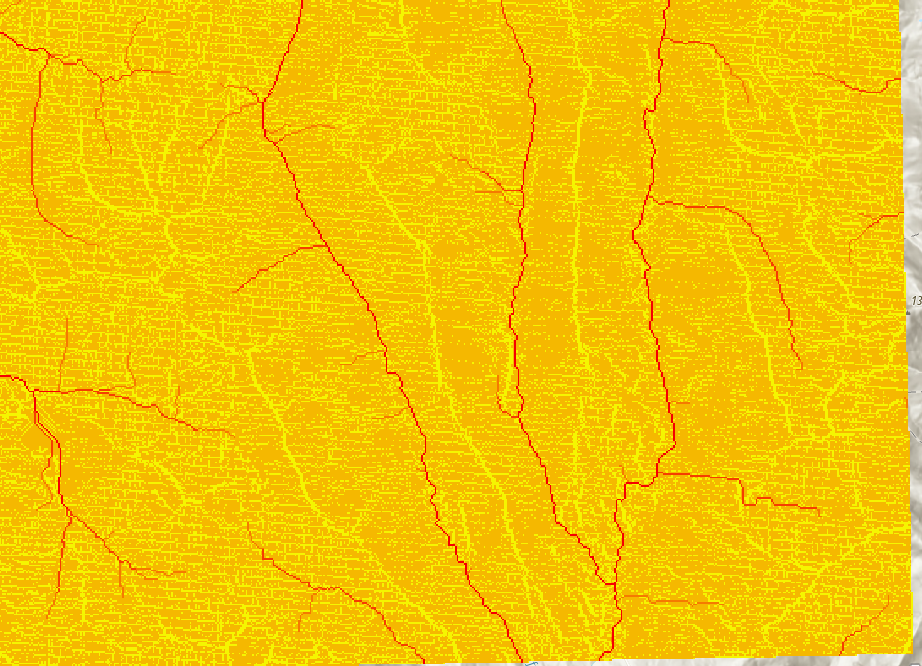
Accumulated stream flow output
Calculate NDVI
You can calculate NDVI directly in Arc
- Just give the red and near infrared bands from a satellite image
- e.g. Landsat8: Red (4), near infrared (5)
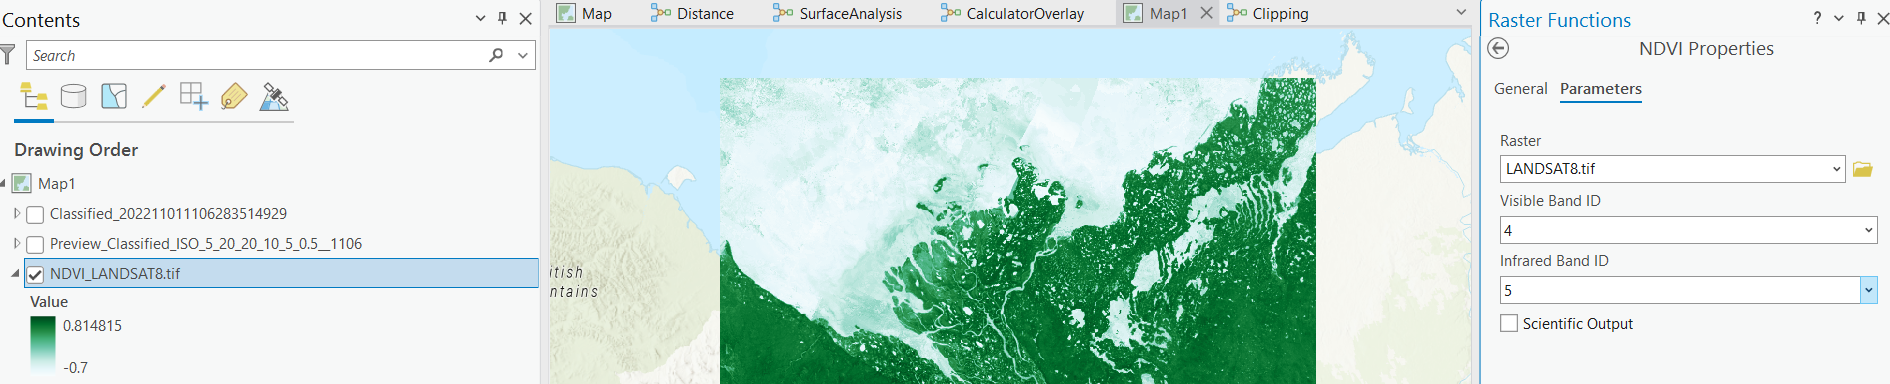
Image Classification
Classify a raster.
- Supervised or unsupervised
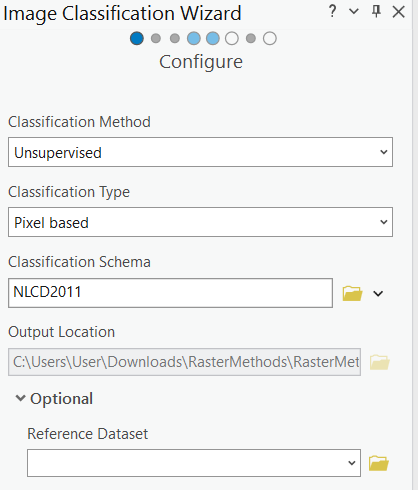
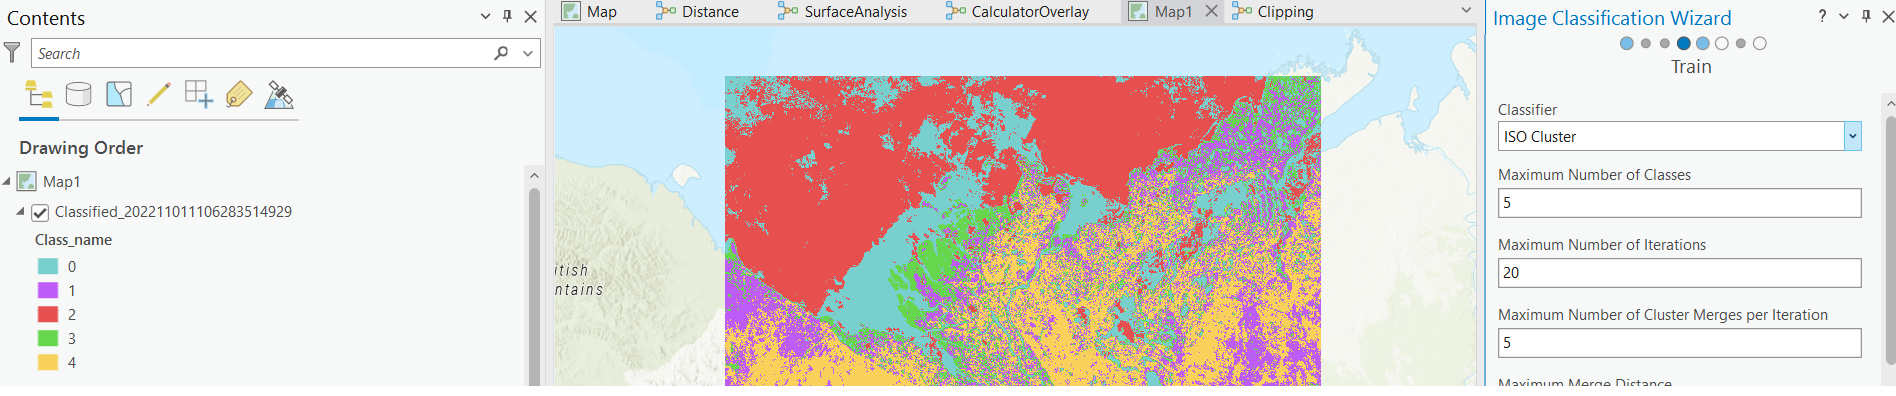
Image Classification
Classify a raster.
- Supervised or unsupervised
TopHat Question 3
This group of raster tools allows us delineate streams and drainage basins from a DEM.
- Hydrology Toolset
- Image Classification
- Kernel Density
- NDVI