Bringing Historical Data into a GIS
We are going to be working with the hand drawn cholera map created by Dr. Snow showing cholera cases in SoHo. I’ve gone thought most of the steps of extracting the data for you already. This section walks you throug the process of how it is typically done.
Note This section covers questions 8 - 10 in the module quiz
Table of contents
Georeferencing
In order to get a historical map into a GIS, it has to be scanned and then georeferenced. To georeference a map like, locations on the scanned image (eg. intersections) can be matched up to known reference points.
- With enough matching points (>=3), an accurate transformation can be calculated and the paper map can be referenced to the proper location. I’ve done this for you to save some time.
- Watch the video linked below for a quick overview of georeferencing.
Once a map has been georeferenced, we can extract information from it. On Dr. Snow’s map, the key pieces of information are the cholera deaths and water pumps. To get this information into the GIS, the points have to be manually identified and entered. This process is known as digitizing, and was explained in the Create points on a map video. We’ll get some practice digitizing in a bit.
Adding the Deaths feature dataset.
The cholera deaths have already been digitized. Follow the steps as outlined and refer to the video below to add the Deaths data to the map.
1) Open the catalog pane and navigate to your Lab1_Project.
- Note This is what I named my project, your project may have a different name depending on how you set things up in the Getting Started step on the Introduction tab.
- ArcGIS Pro shows your project folder by default in the Folders tab in the Catalog pane on the right. To view other folders, you have to add folder connections. We’ll cover this later in the semester.
2) Find the Deaths feature class, which is located in the SourcePoints in the CholeraOutbreak_1854.gdb. Click and drag the deaths feature class onto the map area.
- A geodatabase (.gdb) is a file management structure that is unique to ESRI products.
- Geodatabases are used to store files in Arc Pro. You don’t have to store your data in a .gdb, Arc Pro can work with data stored in regular files as well. But .gdb have some enhanced functionality that makes them better in some circumstances. We’ll discuss .gdb more in more detail later
- SourcePoints is a “Feature Dataset”, a collection of feature classes within a geodatabase that have common properties (eg. projections)
- Right click on the Deaths layer in the table of contents and click zoom to layer.
3) Right click again and open the attribute table to explore the data a bit.
- You can double click count to sort in ascending/descending order.
- Click a row to select a specific feature (eg. identify location with most deaths).
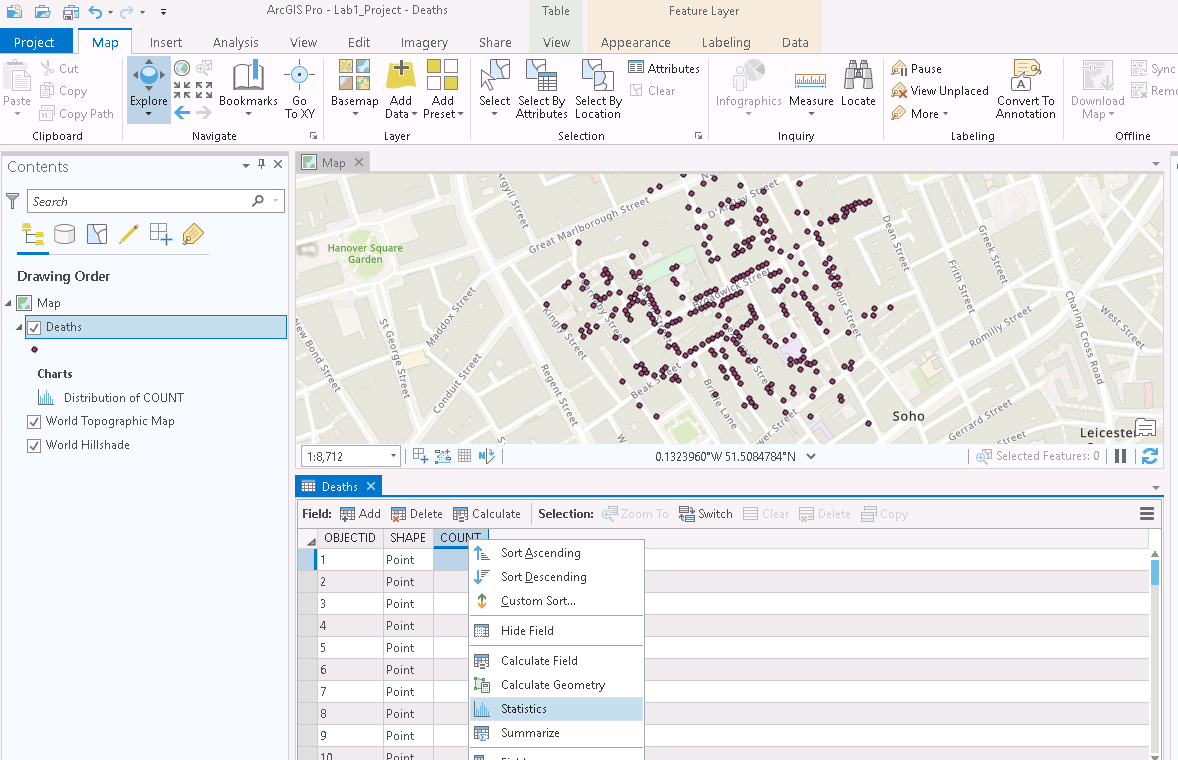
Inspect the Data
Right click “COUNT” in the attribute table and choose “Statistics” as shown below. A chart window and a properties pane will open. Use the statistics in the properties pane to answer the question.
Creating a New Feature Dataset
Using the steps outlined in the video on creating point features, we are going to create a new feature class called “Broad St. Pump” and digitize the location of the pump. Follow the steps as outlined and refer to the video below.
1) Right click on SourcePoints in the catalog pane and click New > Feature Class.
2) In the new window that opens, give the new feature a name and alias, set the type to point, and click Next.
- Arc Pro does not allow Feature Classes to have certain characters (eg. spaces) in file names. But you can set the alias to display spaces
- Feature classes can take multiple different types. The three most common, which we will mainly be concerned with are: Points, Lines, and Polygons
- We’ll discuss the differences in detail in lecture
3) Add a new field called Name with type text then click Next.
- Fields allow us to store information about the features in a table. In this case, the only information we want to store is the name. We will encounter circumstances later where we store many attributes for each feature.
4) Note the Spatial Reference System then click Finish.
- Feature Datasets require that all feature classes within them have the same Spatial Reference System, so the projection is automatically set to that of the SourcePoints feature dataset (WGS 1984 Web Mercator)
- If you aren’t working in a preexisting feature dataset, this would be your chance to specify it
- We don’t need to concern ourselves with the options on the next three pages for now.
Digitizing a Point
Now we are going to digitize the location of the Broad St. Pump. Follow the steps as outlined and refer to the video below.
1) Find the Snow_cholera_map in the CholeraOutbreak_1854.gdb, click and drag it onto the map.
2) Open the Edit tab and click Create, in the create pane that appears, click Broad St. Pump and choose point from the options that appear.
- The edit tab allows us to create, modify, save, and delete data among other things
- Create is used specifically to add new features to an existing feature data set.
- Right now we’re creating a single point feature. We’ll learn how to digitize lines and polygons later on in the semester.
3) Click on the location of the Broad St. pump as shown on Dr. Snow’s original map, then save your edits.
- Zoom into the Broad St. area on the map, click on the location of the pump to add a point feature.
- If you make a mistake, you can hit ctrl + z to undo your additions
- Note Snapping is sometimes set to on by default. It will cause the cursor to jump to the nearest feature in another layer (eg. Deaths). It is useful in some situations, but not here. It can be turned off by clicking snapping in the Edit tab.
- Save your edits after every change to make them permanent.
4) Open the attribute table and name the newly created feature “Broad St. Pump”
- You can type directly into the attribute table to edit the newly created features Name value, which is blank for now.
- Clicking a new row in the attribute table will add and “empty” feature with no spatial component.
- You can right click on a row to delete that feature
- Save your edits to make them permanent.
Save your project.
Click Save in the top left of the Arc Pro window. ArcPro will auto save for you every so often, but its good practice to get in the habit of saving everything regularly anyway just incise.