Making a Map
Now that you’ve used kernel density to identify the location of the pump, we’ll make our first map using a layout and add all the necessary map elements.
Note This section covers question 14 in the module quiz
Table of contents
Creating a Layout
Follow the steps as outlined and refer to the video below to add a new layout.
- Click the Insert tab and select Layout. Choose an appropriate page size. Letter size is good for most maps in this class, only use the bigger ones if you are making a poster.
Adding Map Elements
Follow the steps as outlined and refer to the video below to add the necessary map elements. These map elements should be present on each map you make for the class unless otherwise specified.
Legend
Add a legend. Remove any unwanted items from the legend using the check boxes. Change the symbology of Kernel Density to 5 classes so it fits on the legend better and edit the layer name to make it more clear. Reorder the legend items if desired.
- Legends items have many different settings we can fine tune. For now, we’ll just change a few.
- You can add/remove & reorder legend items using the check box on the right.
- Changing the number of classes in the Kernel Density layer makes it fit better.
- Slowly double clicking on an item in the table of contents on the left allows you to edit the text. You can change layer names so they make more sense.
Title
Add a a title using the Straight Text (see video). Give your map an appropriate title and font size
- Titles should be concise and descriptive.
- They should be the largest font element on the map
Source Statement
Use the same procedure to add a data source, creator name, and date to the map.
- It is important to credit data sources.
- List yourself as the creator.
- Add a date so the reader knows when the map was created.
- The credit text can be smaller and “tucked away” at the bottom of the map.
Scale Bar and North Arrow
Add a north arrow & scale bar
- Make sure your units are in metric!
Export Your Map
File Submission: Save the layout as a .pdf, name it Kernel_Density.pdf. You will upload it to canvas.
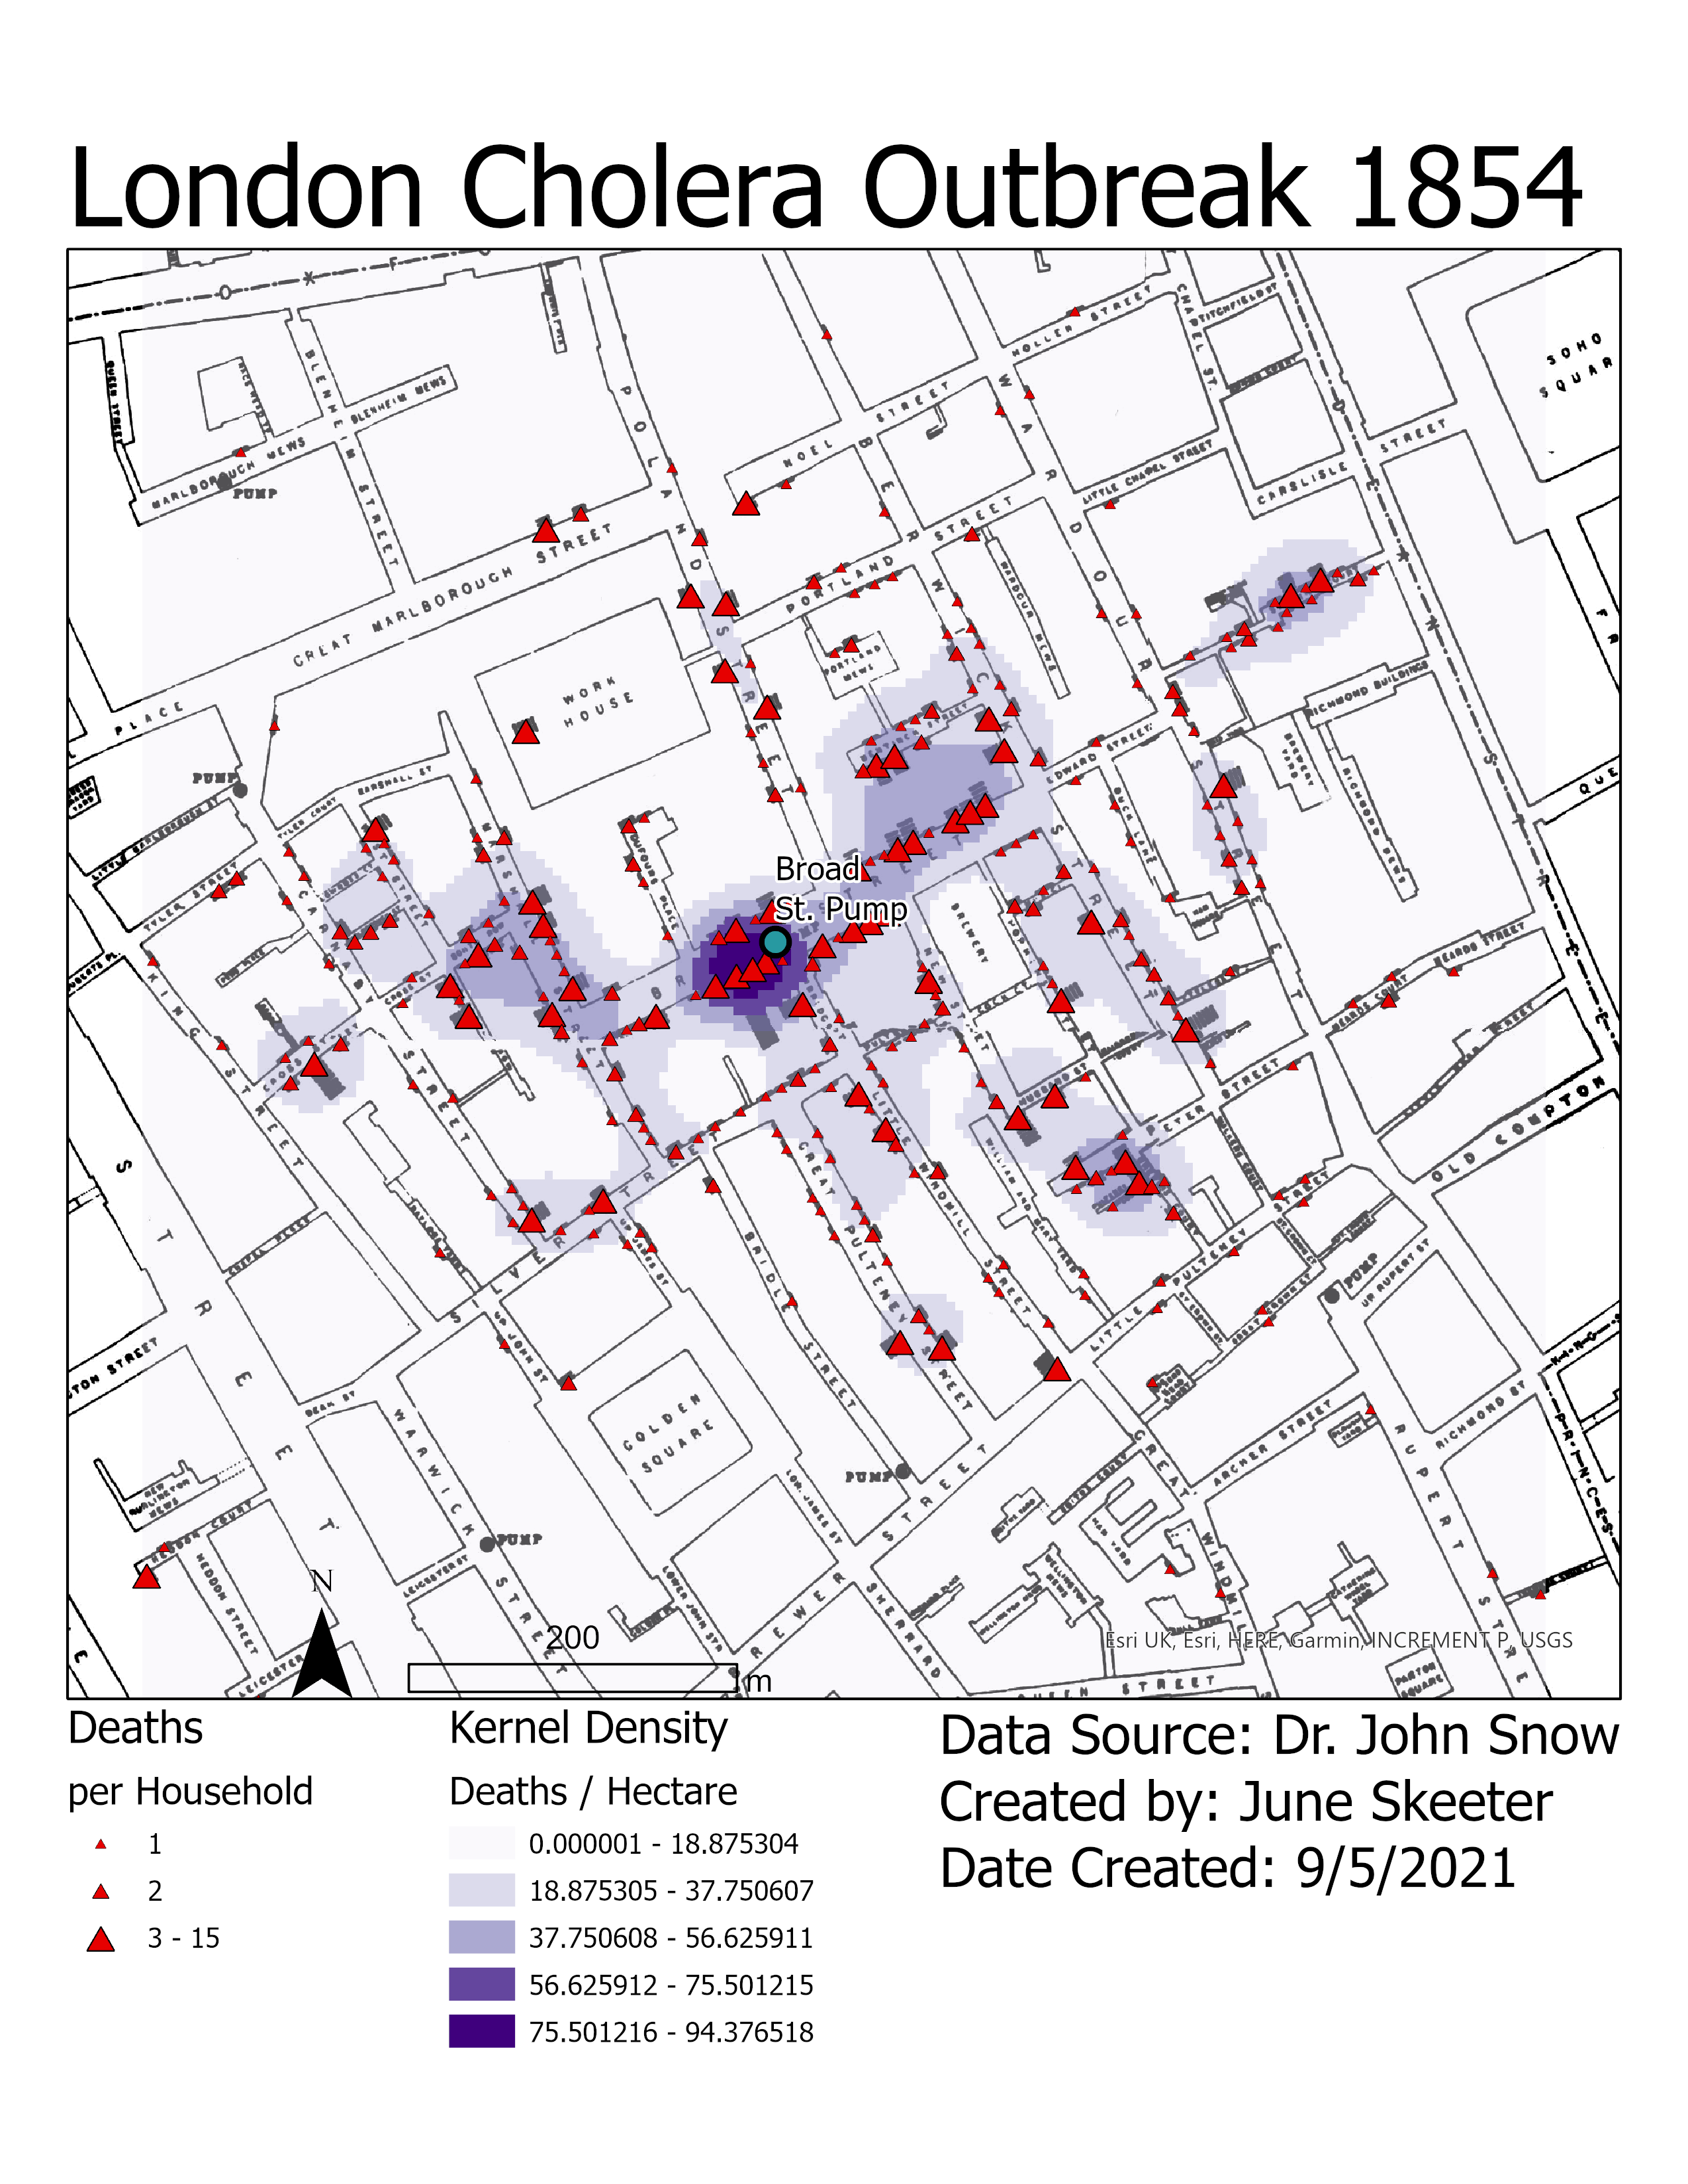
- Your map should look something like the map shown below. Different colors, element sizes, etc. are fine. But it should have all the map elements listed above.
Save your project.
Click Save in the top left of the Arc Pro window.
- If you are working on a Geography Department Lab computer, make sure to save your work the the H:/ drive and log off properly. See the video of on the Lab Details page on canvas for a more detailed explanation.